RACI Matrix

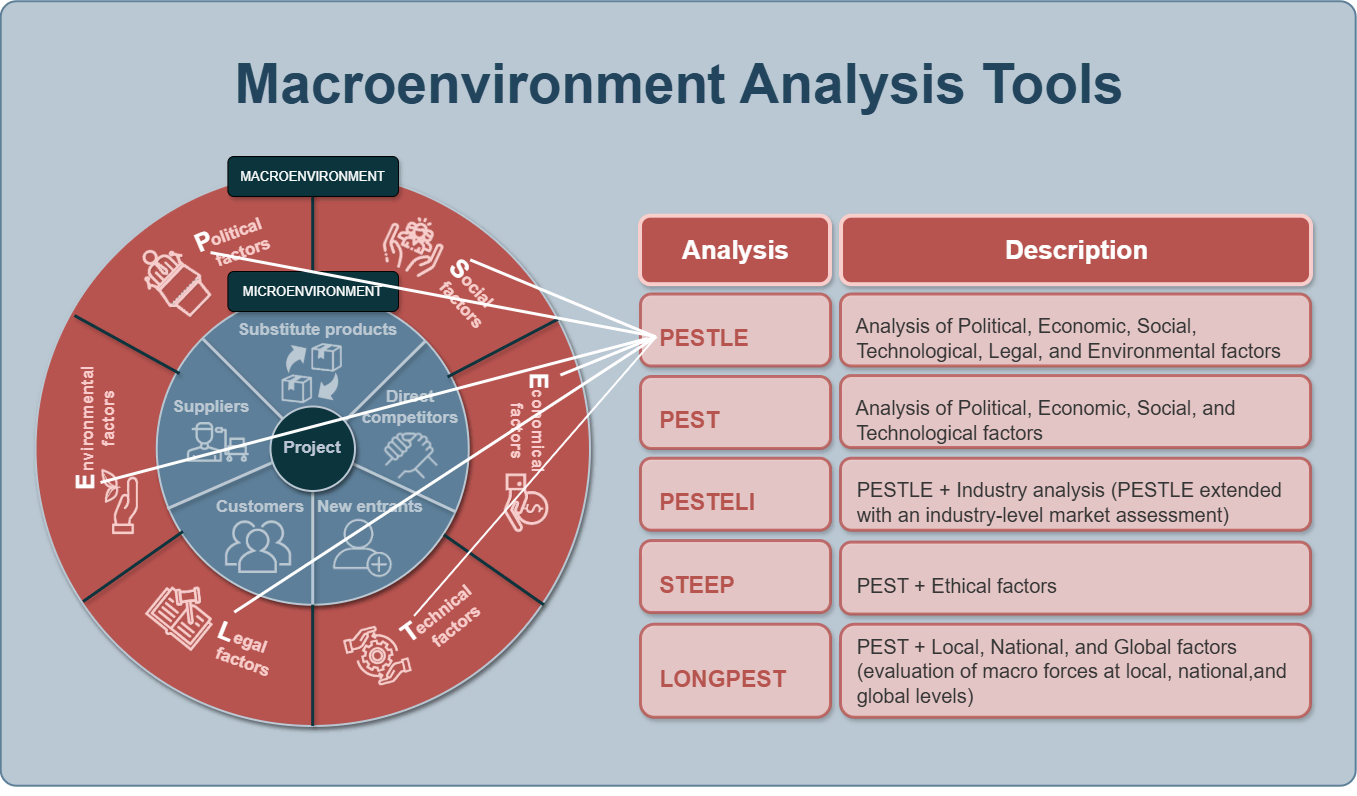
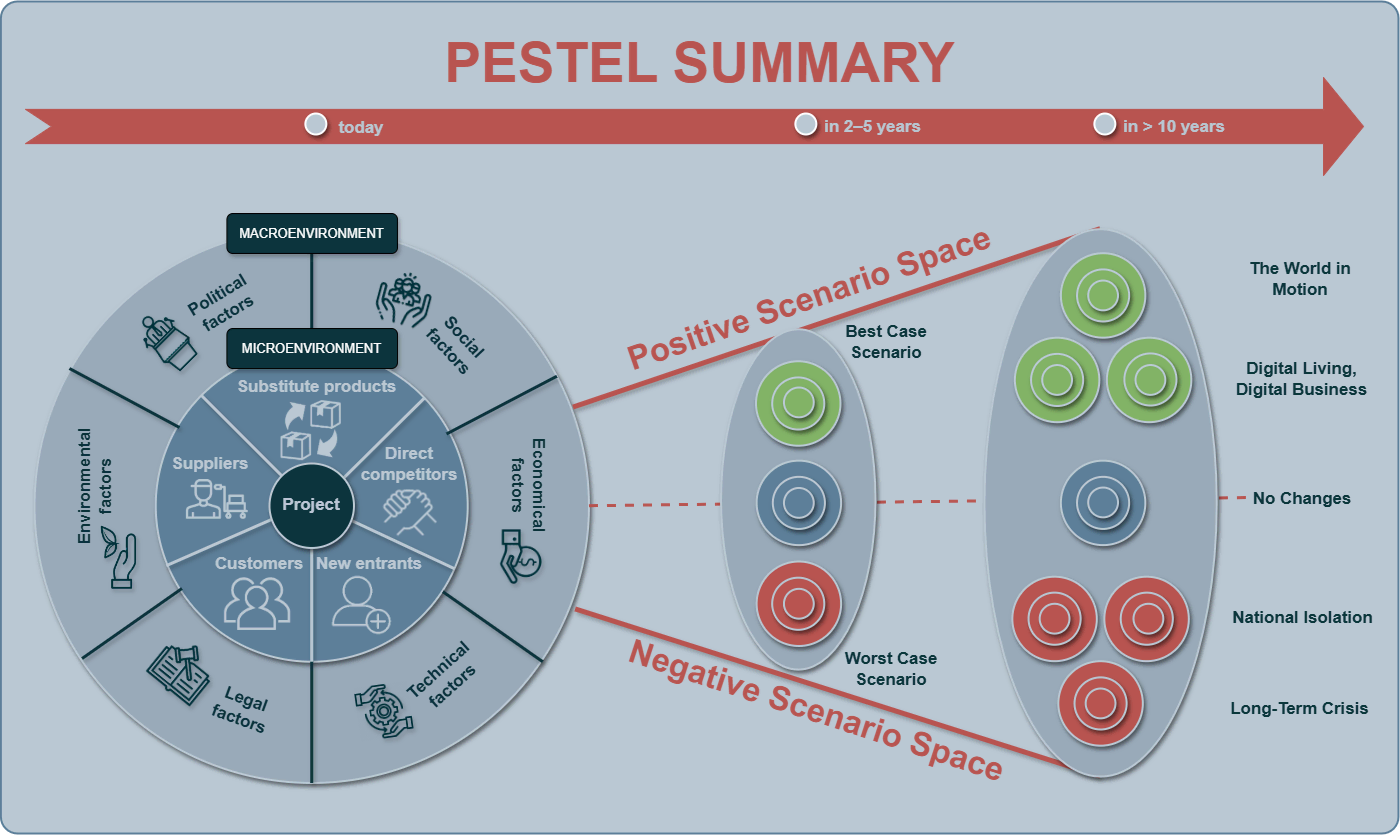
PESTEL Analysis

JTBD
PII
SWOT

PEST

Strategy Synthesis

SWOT Analysis


-

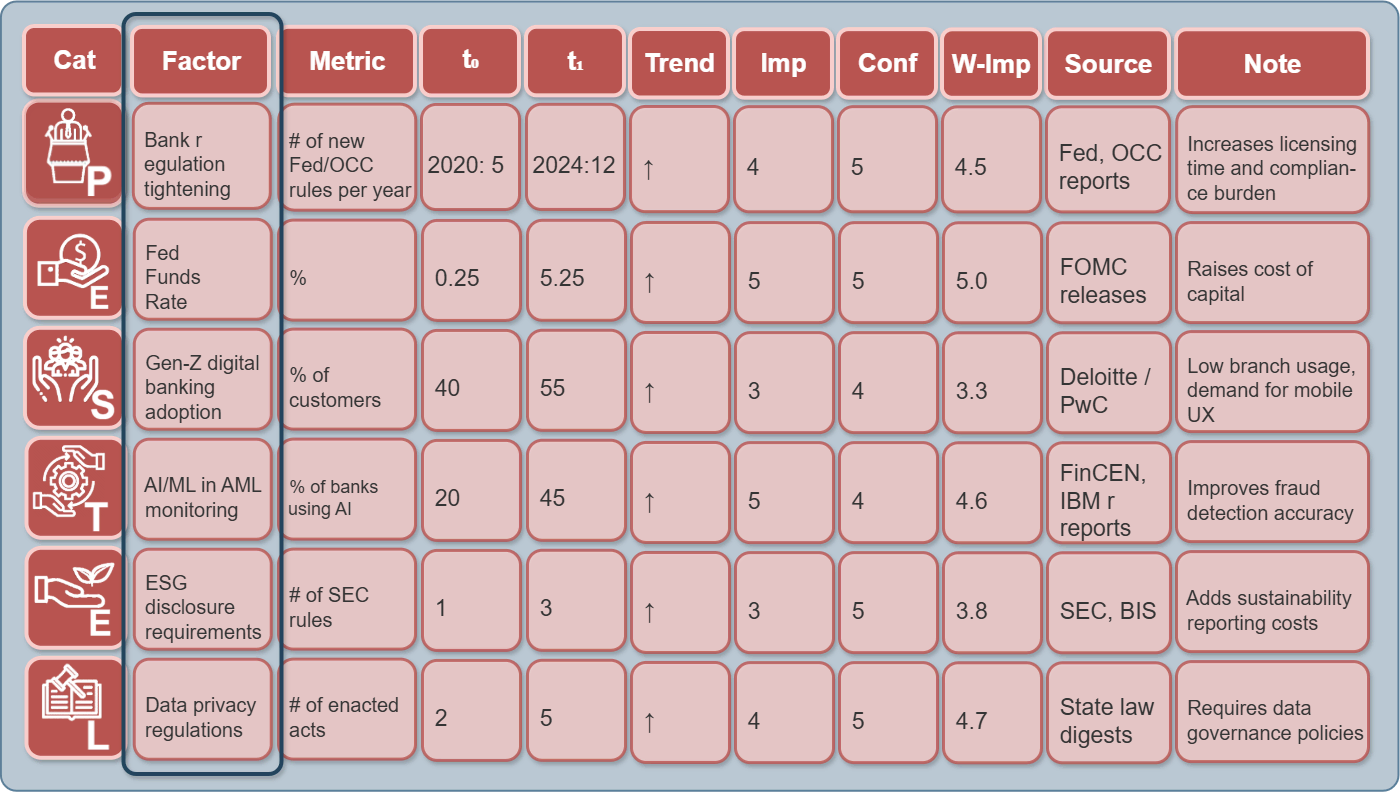
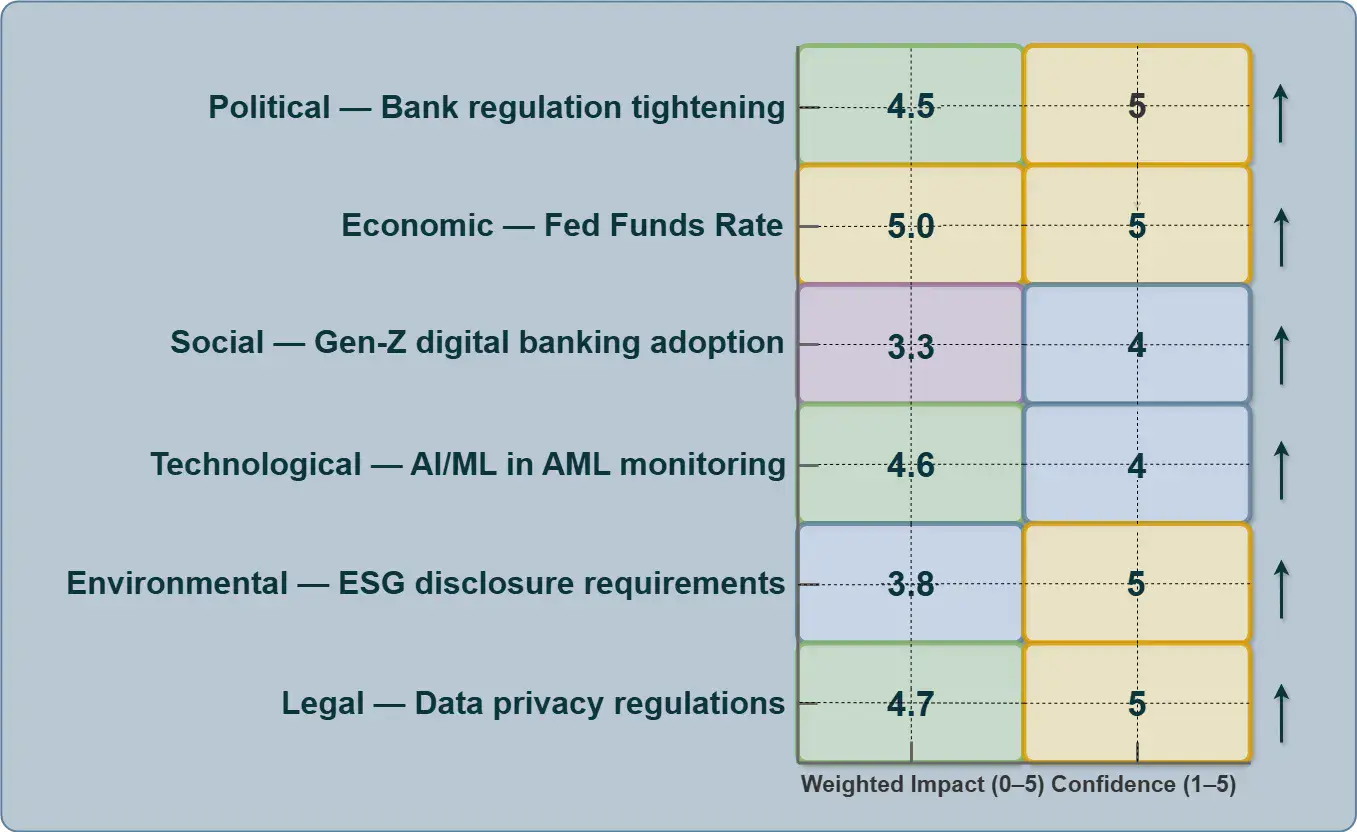
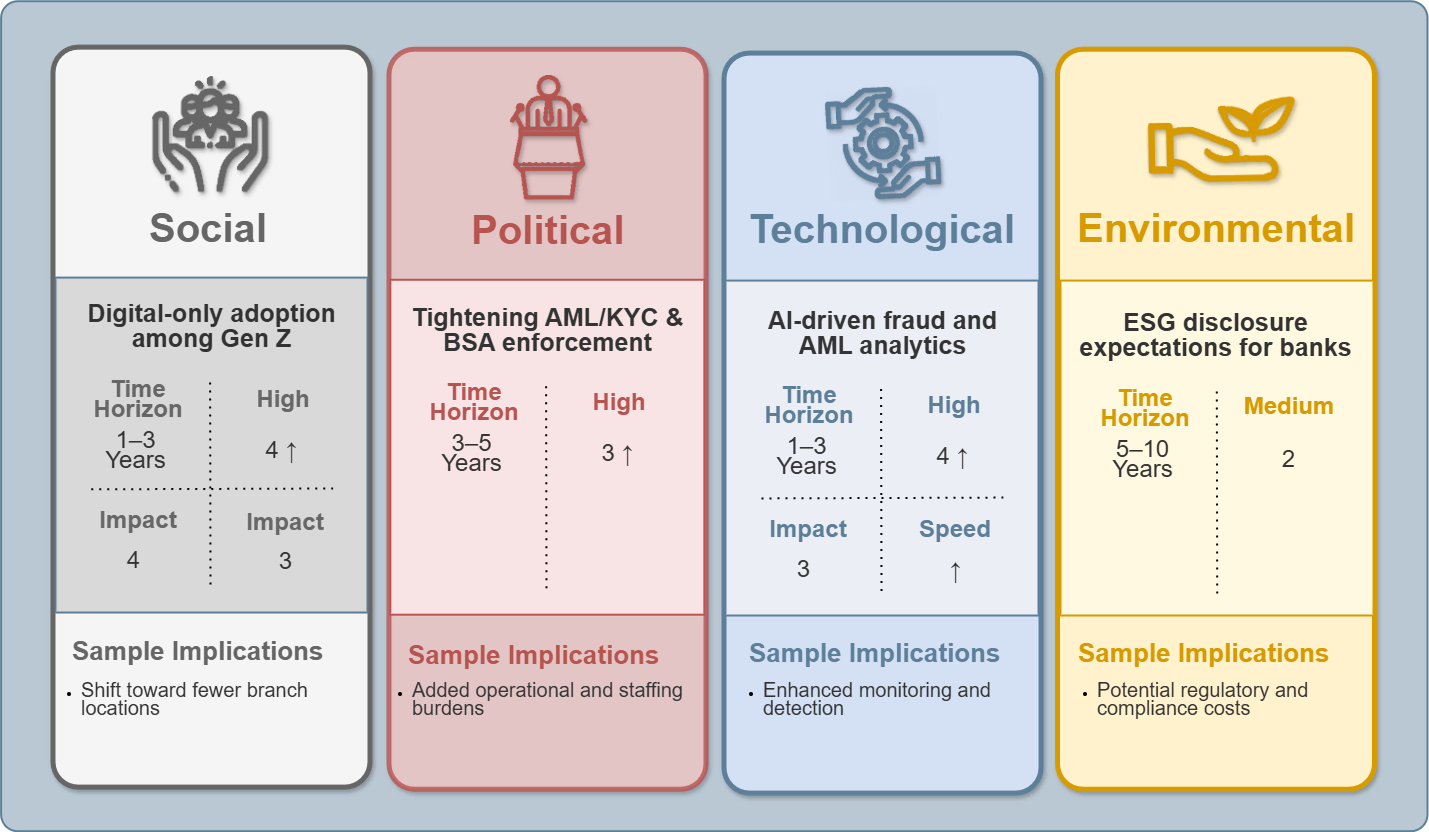
PESTEL Analysis
document concrete factors + validate them with data and sources + make an initial assessment of trend/impact/confidence.
-

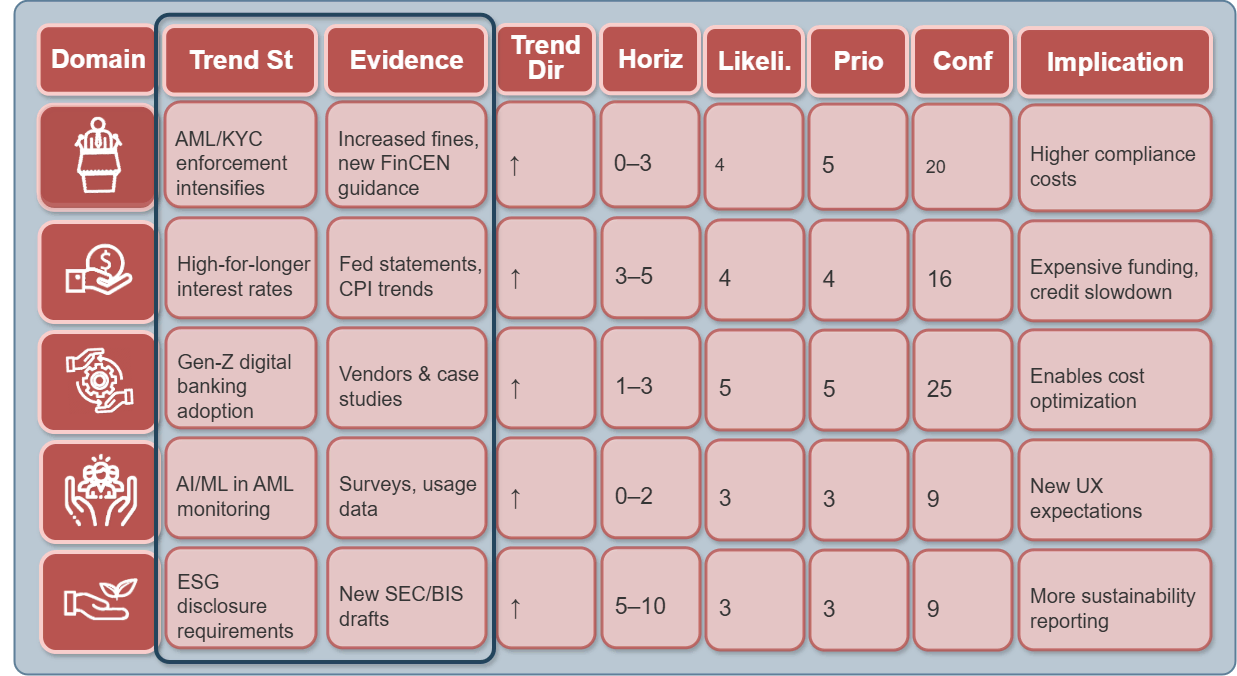
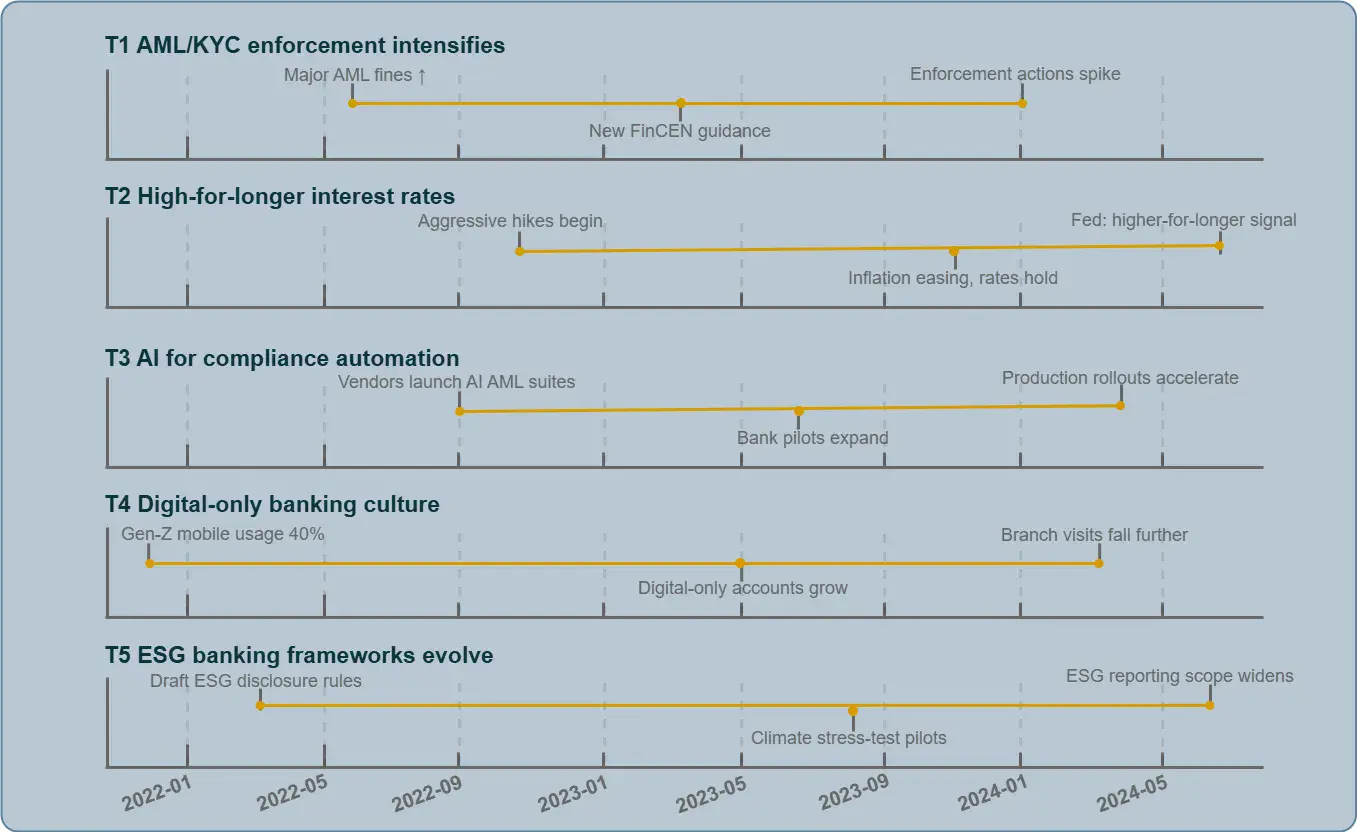
Scenario Trend Scan
transform factors into defined trends with time horizons and signals, normalize probability and impact using agreed scales.
-

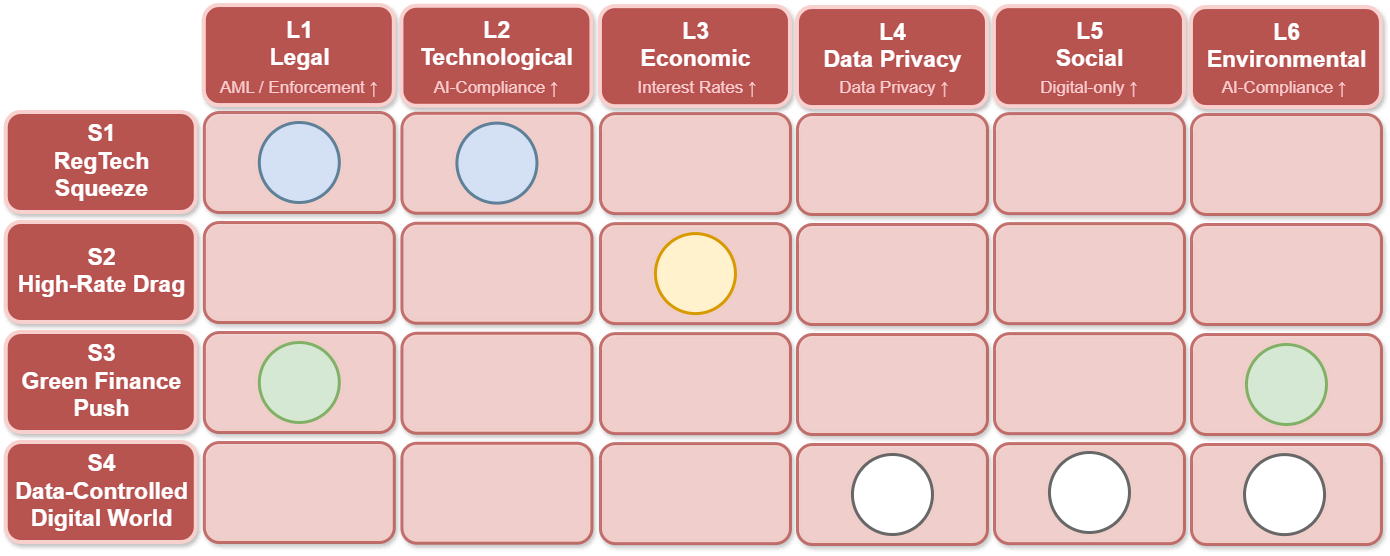
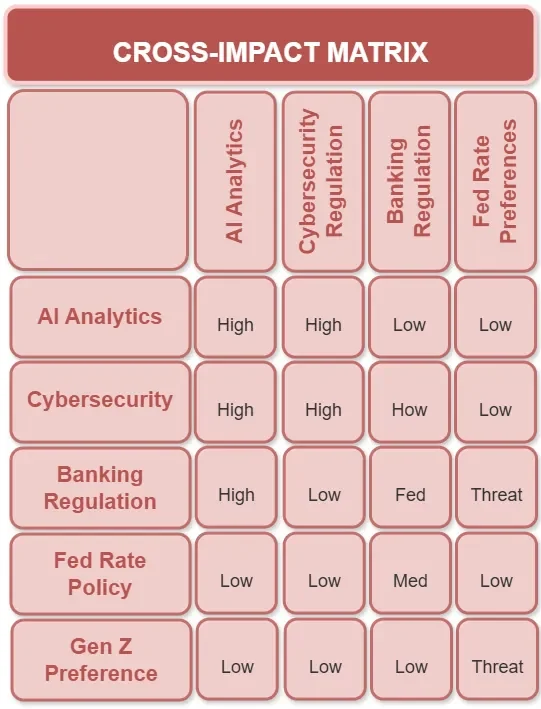
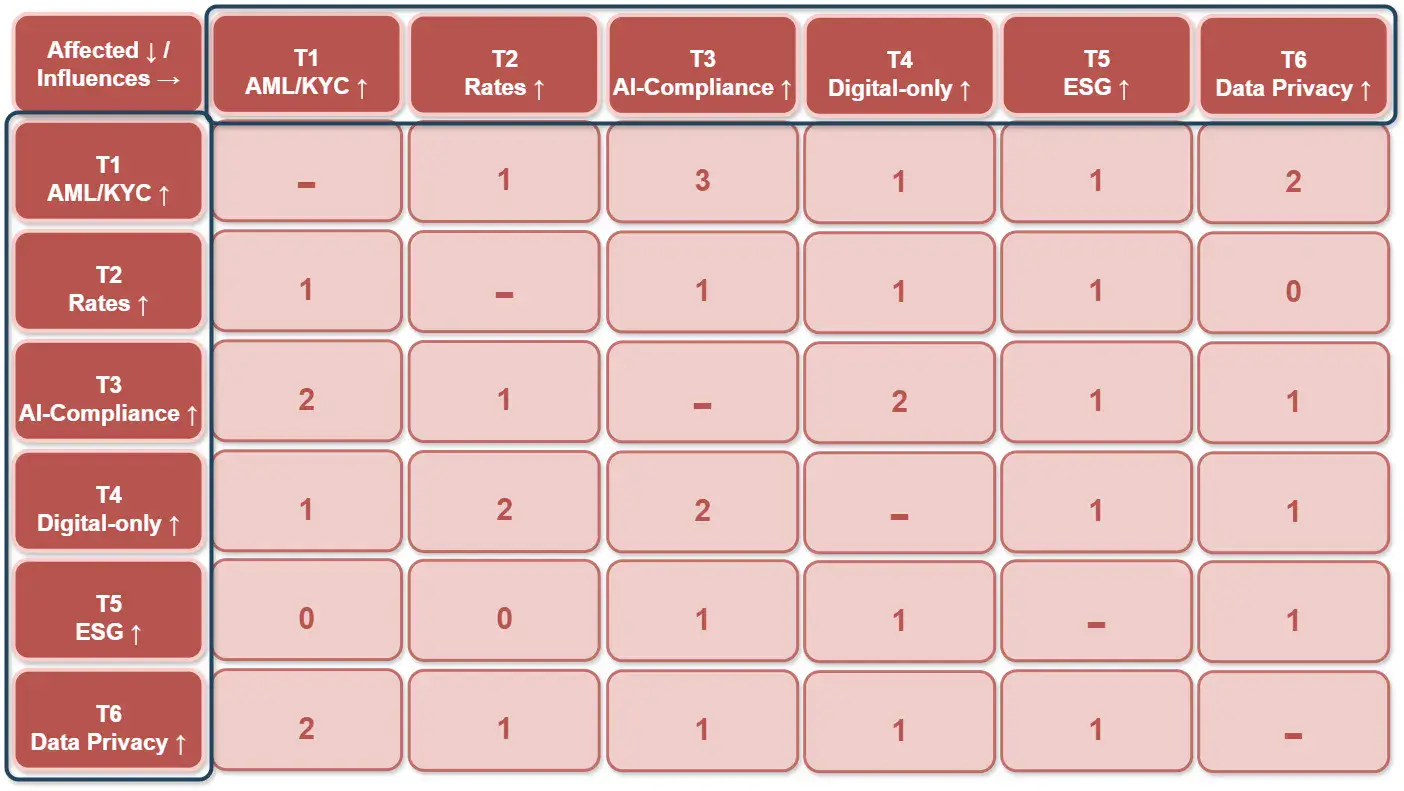
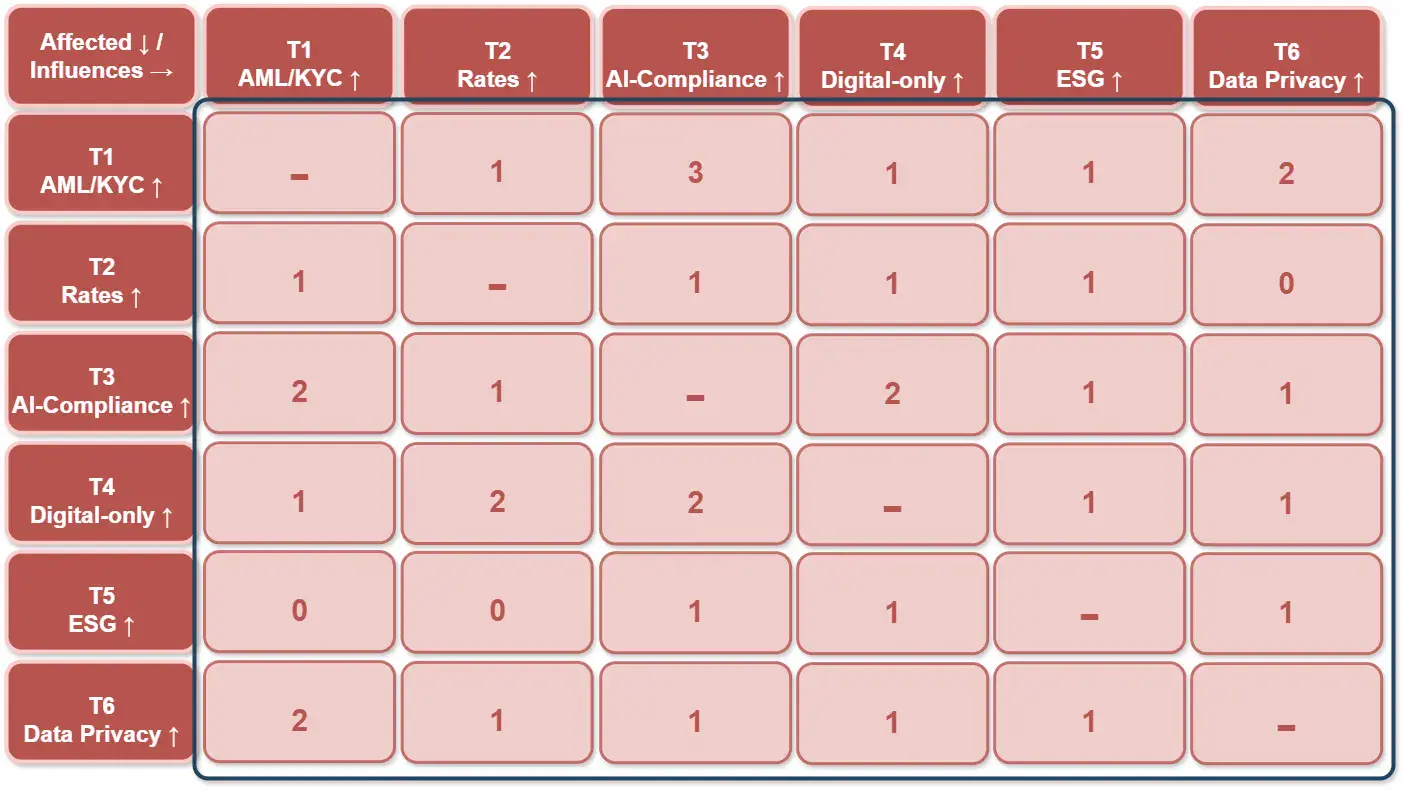
Cross-Impact Assessment
for the top trends, record directional influences on one another (who affects whom and to what extent), calculate driver score and vulnerability score, and identify key drivers and weak points.
-
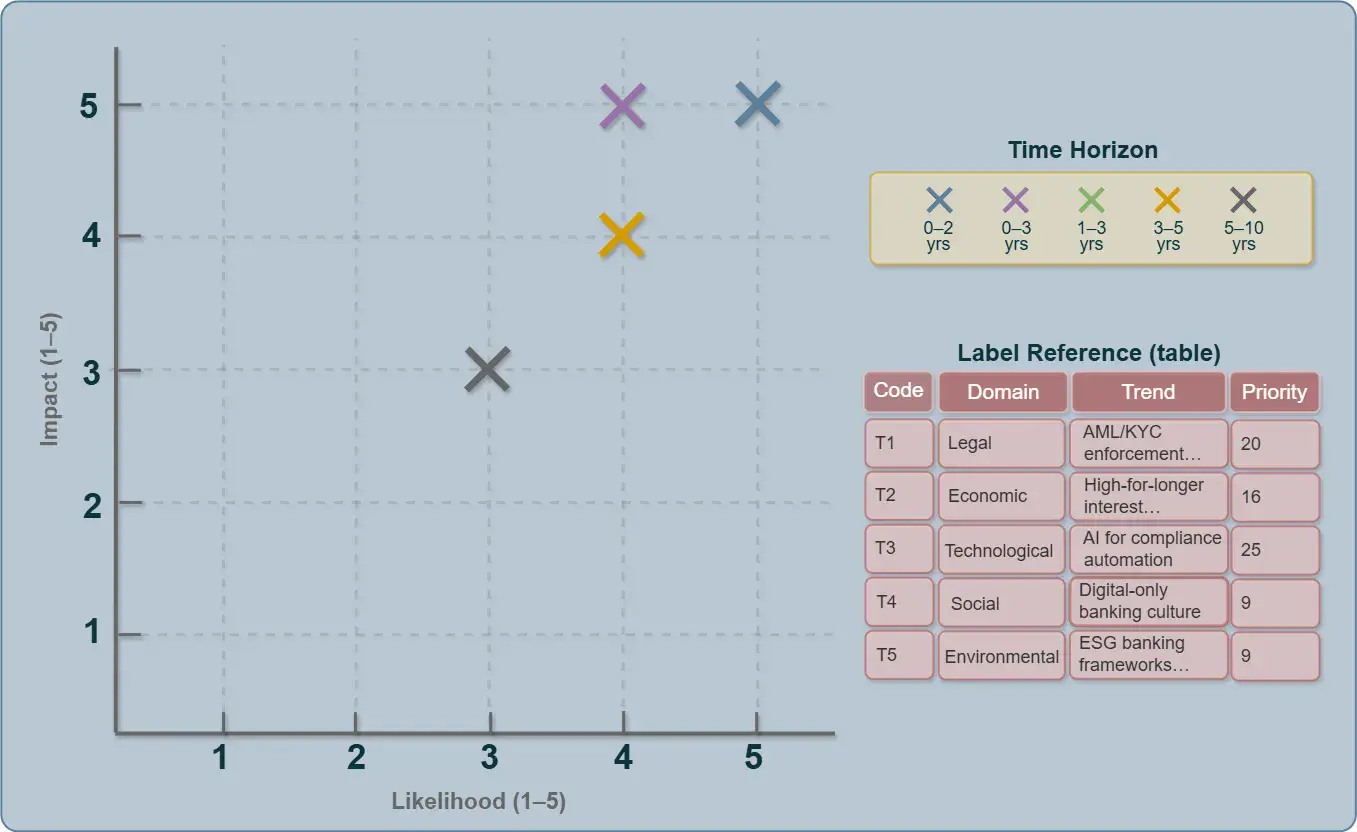
Sensitivity Mapping
build scenarios from the identified drivers (configurations of trends), calculate probability, impact on the project, and priority (risk/opportunity score) for each scenario, resulting in a ranked scenario list and sensitivity maps.
-

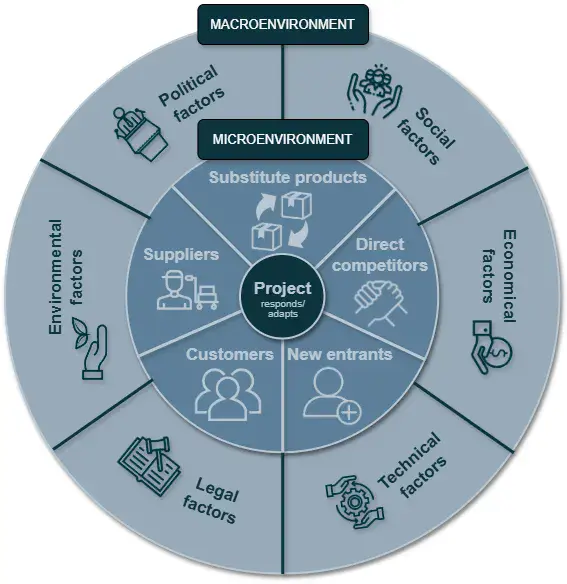
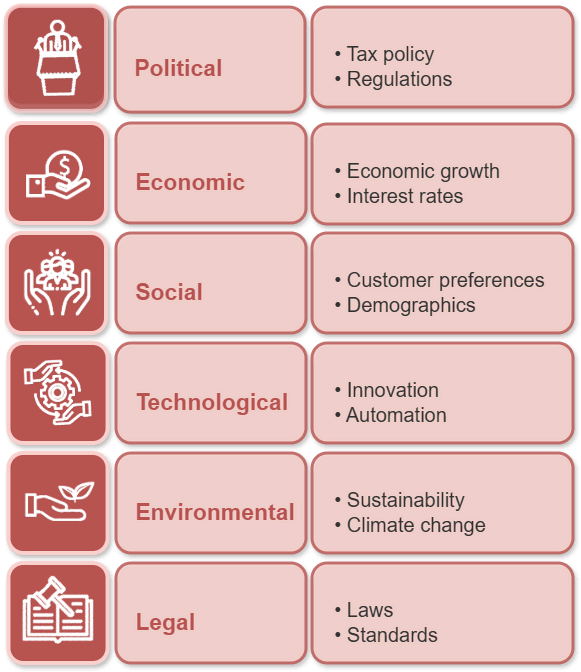
Political
political and legal decisions, stability, tax policy, government programs.
-

Economic
macroeconomics: inflation, exchange rates, income levels, investment climate.
-

Social
demographics, cultural values, lifestyle, consumer behavior.
-

Technological
innovation, speed of technology adoption, R&D, automation.
-
Environmental
ecology, climate, sustainability, emissions regulation.
-

Legal
laws, licensing, standards, consumer and data protection.


-
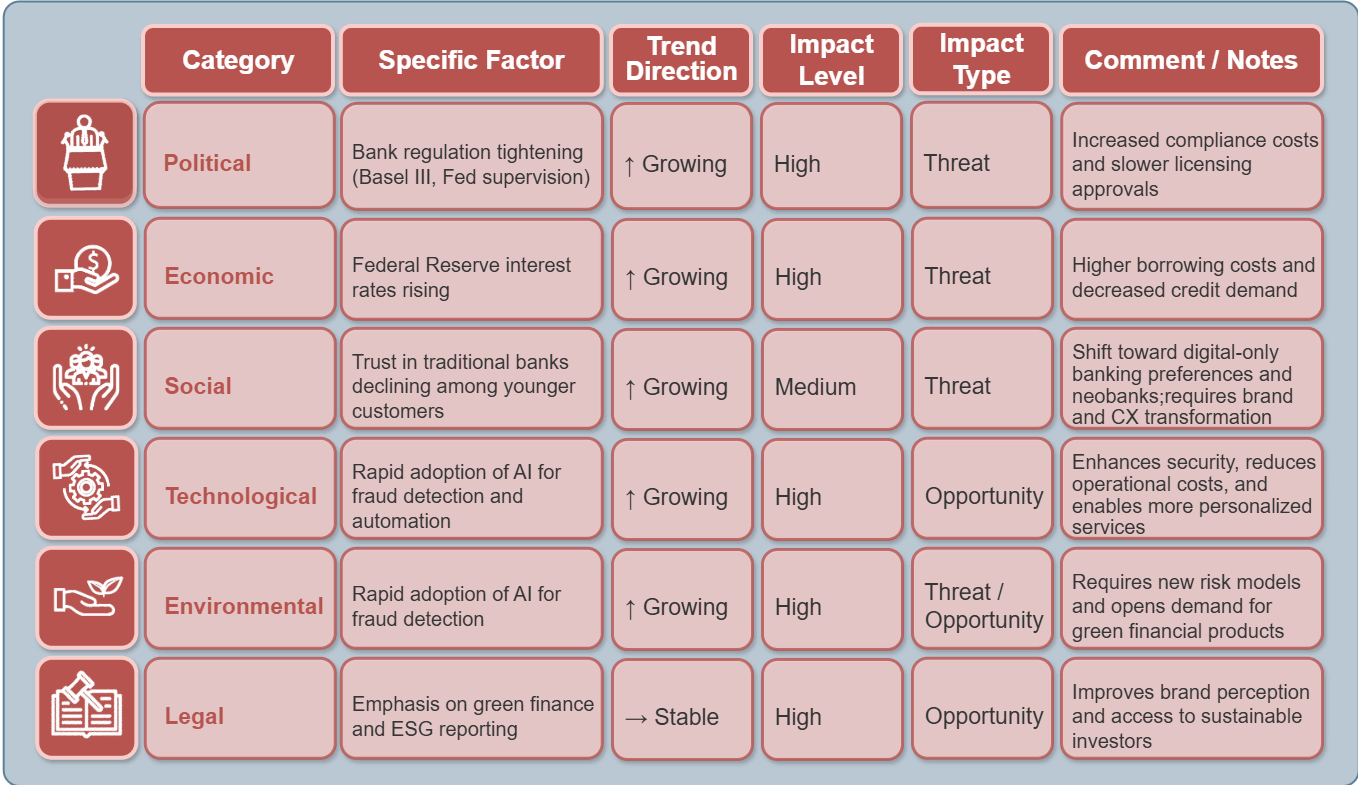
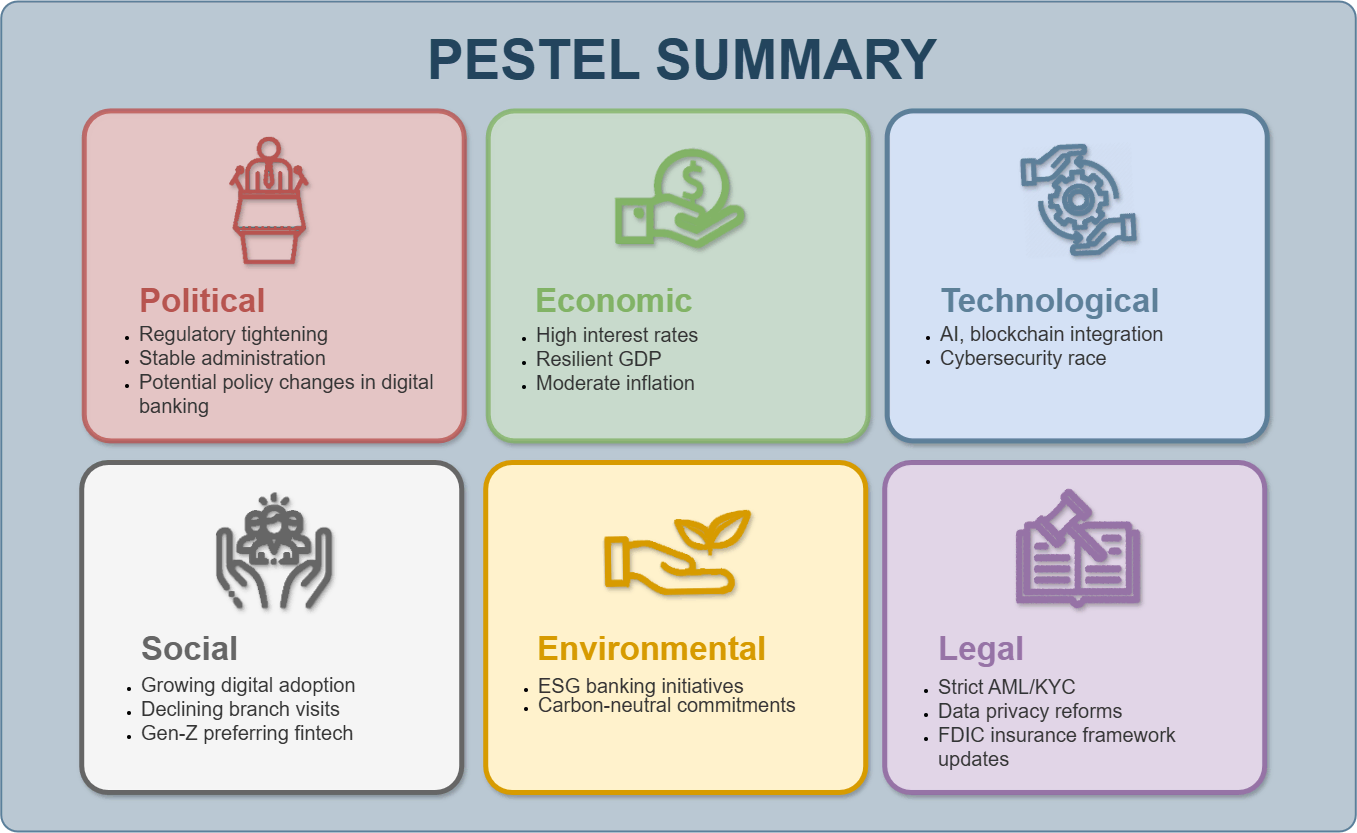
Political
stricter regulation and Basel III oversight
-
Economic
increase of the Federal Reserve interest rate
-
Social
AI adoption in AML
-
Technological
declining trust in banks among younger audiences
-
Environmental
focus on ESG
-
Legal
tightening of KYC/AML requirements


-
Political
Basel III Endgame, federal regulatory shifts, government oversight trends.
-
Economic
Federal Reserve rate hikes, inflation, rising unemployment.
-
Social
Customer shift toward digital-only banks, declining trust in traditional institutions.
-
Technological
AI/RegTech for fraud prevention, increasing cybersecurity requirements.
-
Environmental
ESG requirements, “green” lending.
-
Legal
Stricter AML/KYC requirements, OCC licensing procedures, compliance obligations.
-

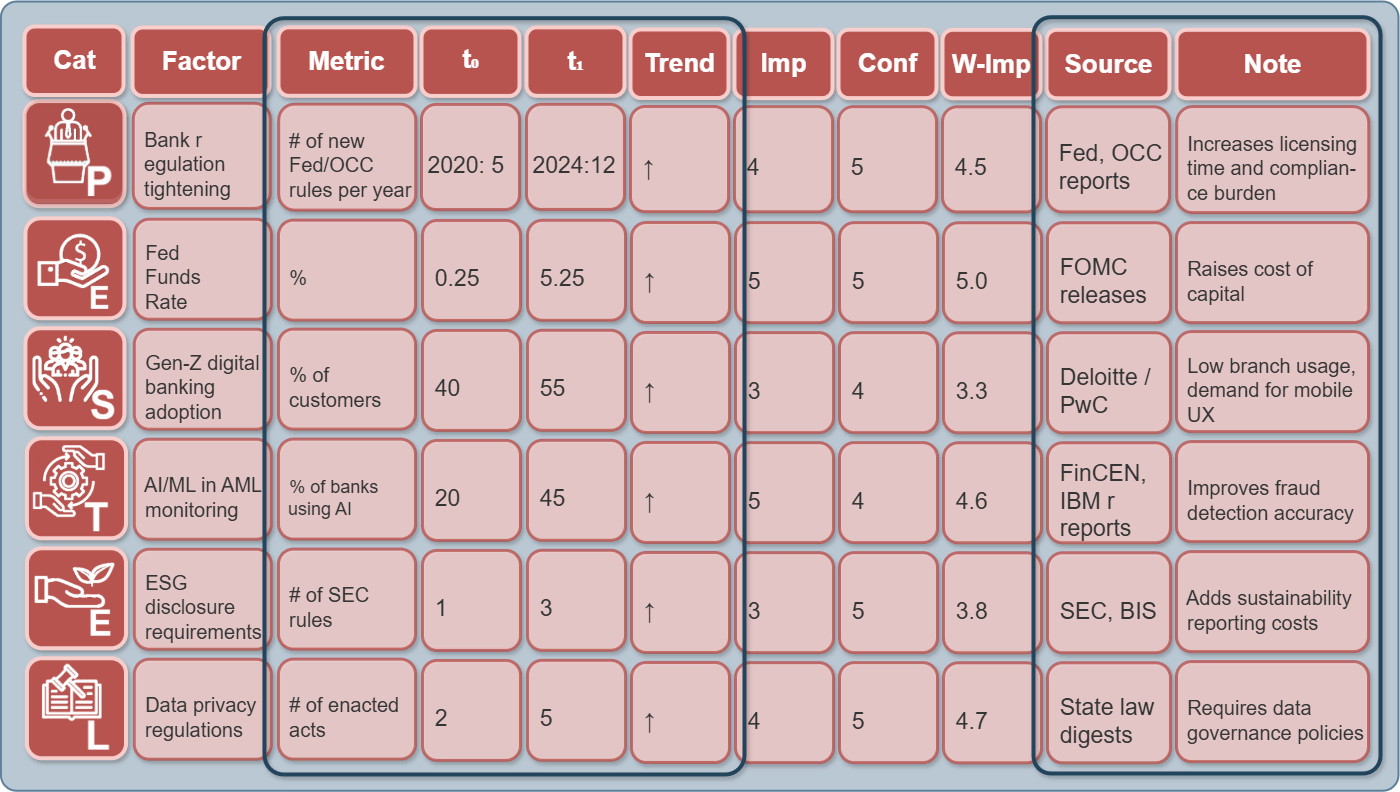
Metric:
Quantifiable measure (e.g., interest rate %, fraud incidents/year).
-

Baseline (t0)
The initial reference point for the factor.
-
Current Value (t1)
The current value of the factor at the time of analysis.
-

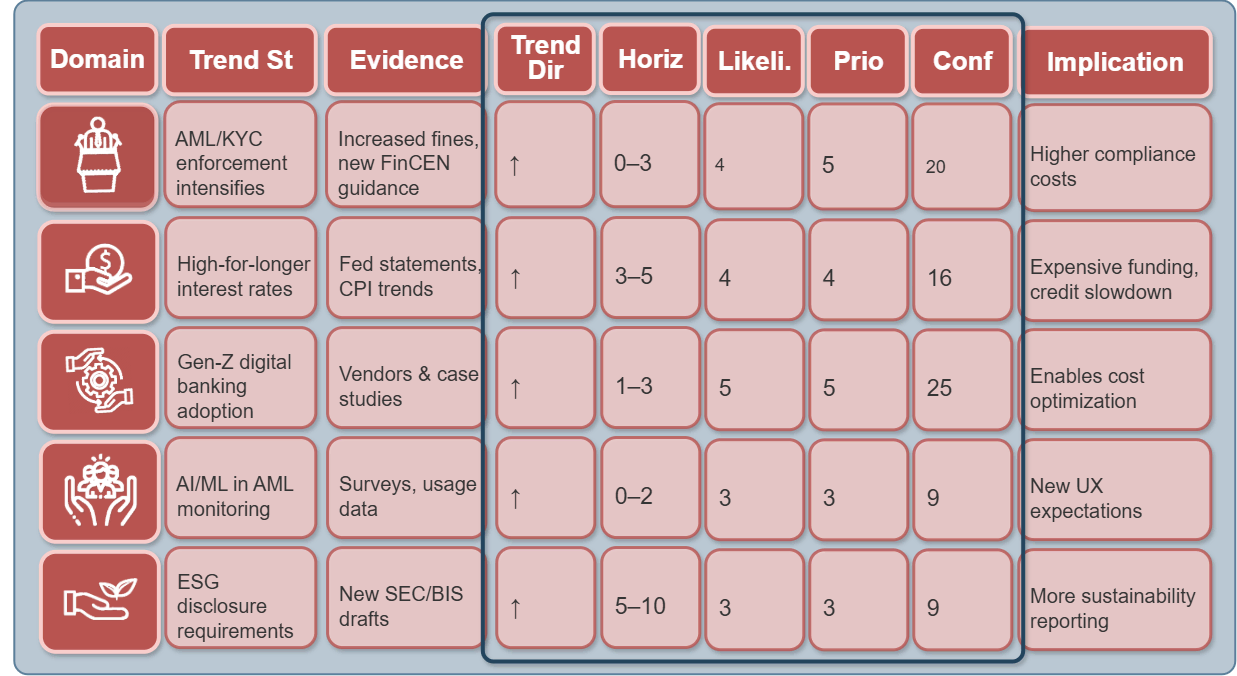
Trend Direction:
↑ Increasing / ↓ Decreasing / → Stable.
-

Data Source:
Official reports (Fed, FinCEN, BIS, IMF, etc.)
-
Comment:
Interpretation for the project.
-
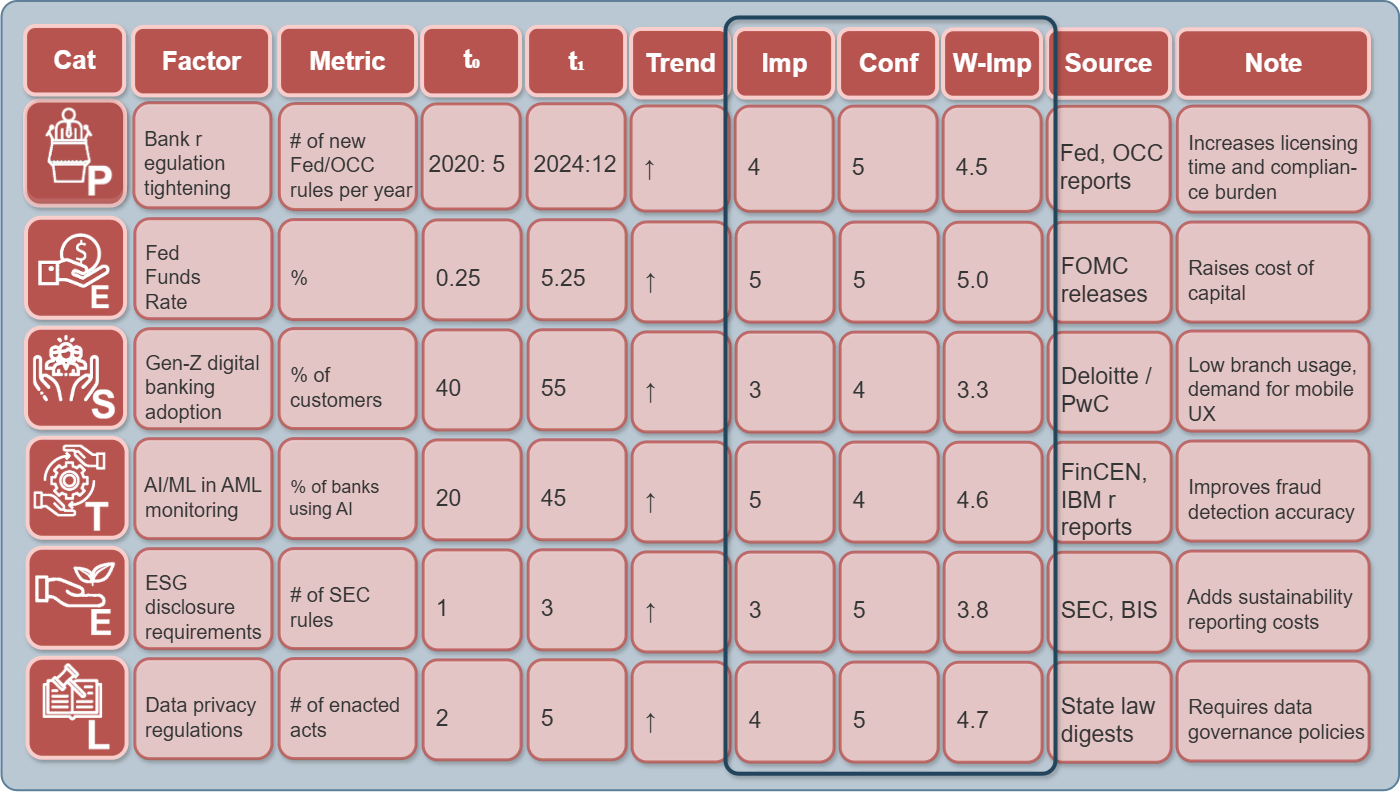
Impact:
A numerical score showing how strongly the factor influences the project or market.
-

Confidence:
Data quality (1–5).
-
Confidence-Adjusted Impact:
A confidence-adjusted estimate of impact, reflecting both the strength of the factor and the reliability of the underlying data.


-
Trajectory:
↑ growing / ↓ declining / ↔ stable / ± volatile.
-
Time Horizon:
0–2 / 3–5 / 5–10 years.
-
Likelihood (1–5):
probability of continuation.
-
Impact (1–5):
effect on project KPIs.
-
Priority =
Monitoring & sequencing metric.

-

Legal — AML / Enforcement ↑
Intensification of regulatory and enforcement pressure (AML/KYC, BSA).
-

Technological — AI-Compliance ↑
Growing role of AI and automation in compliance and RegTech.
-

Economic — Interest Rates ↑
Prolonged high interest rate environment.
-

Data Privacy — Data Privacy ↑
Stronger data control, privacy regulation, and data governance requirements.
-

Social — Digital-only ↑
Shift of customers toward digital-only banking and changing consumer behavior.
-

Environmental — ESG ↑
ESG requirements, sustainable finance, “green” products, and disclosure.


-

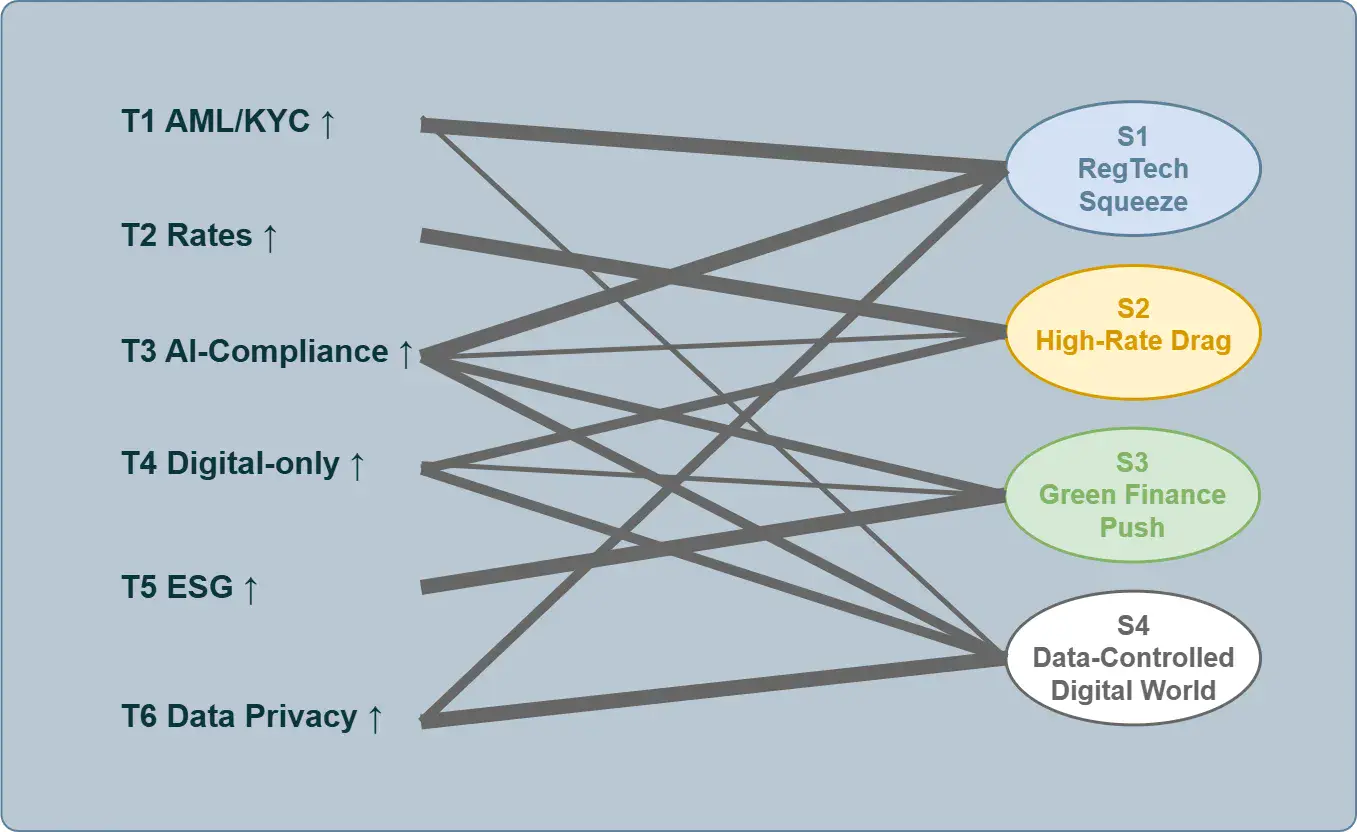
Cells:
impact strength (H / M / L or 3 / 2 / 1). No single factor ever exists in isolation.
-

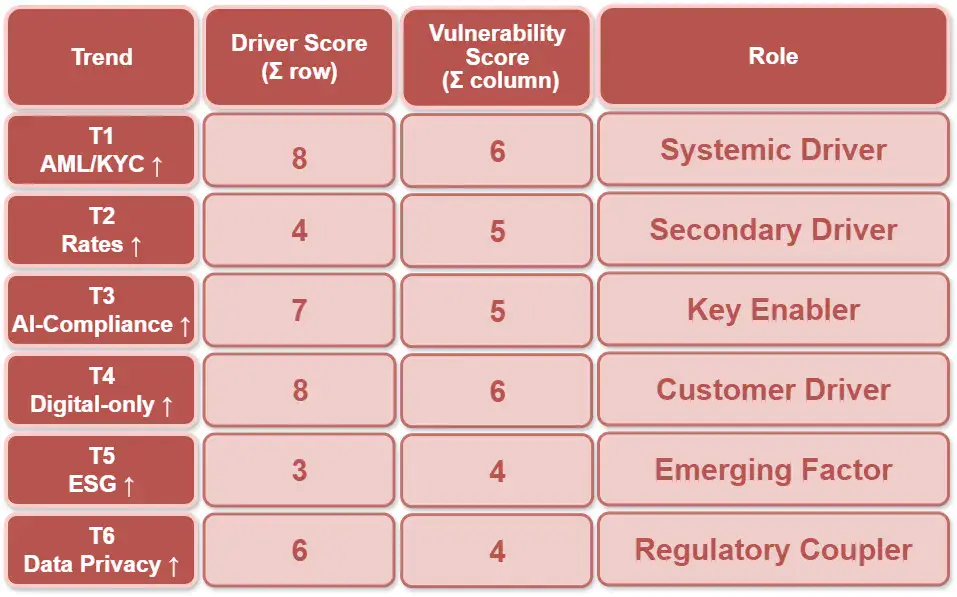
Driver Score (∑ across the row):
— the total impact of a trend on other factors → indicates who “drives the system.”
-

Vulnerability Score (∑ down the column):
— the total impact of other factors on a given trend → indicates who is most dependent.
-

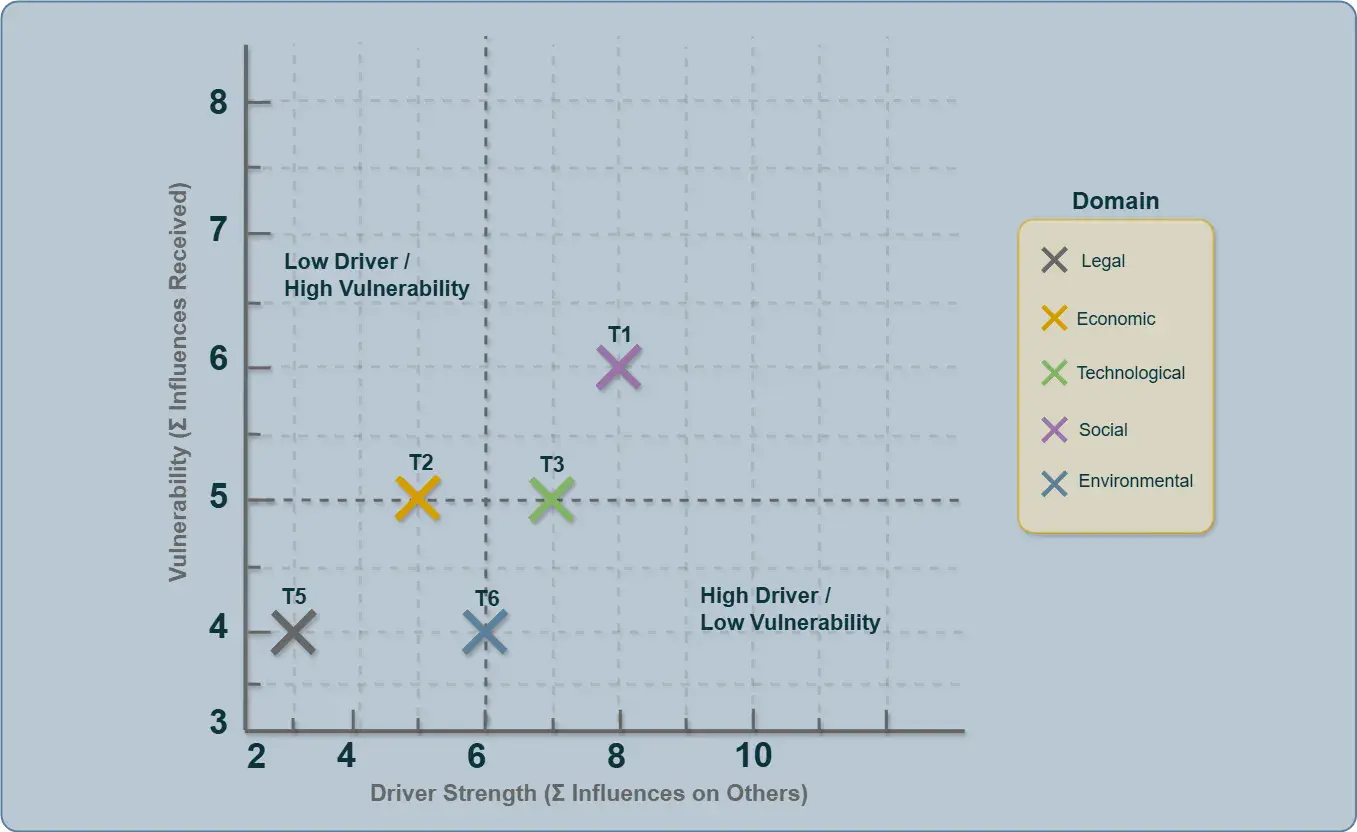
Key Drivers:
— trends with a high Driver Score and a relatively low Vulnerability Score.
-

Sensitive Nodes:
— trends with a low Driver Score and a high Vulnerability Score.
-

AML/KYC Enforcement ↑
(systemic regulatory driver)
-

AI Compliance ↑
(key technological enabler)
-

Digital-only Banking ↑
(consumer behavior driver)
-

ESG ↑
(shaping long-term requirements and standards)
-

Data Privacy ↑
(regulatory-systemic linking factor)

-

Business-as-Usual
— minimal changes
-

Disruption
— structural shifts and regulatory shocks
-

Transformation
— sustainable transformation of the banking model
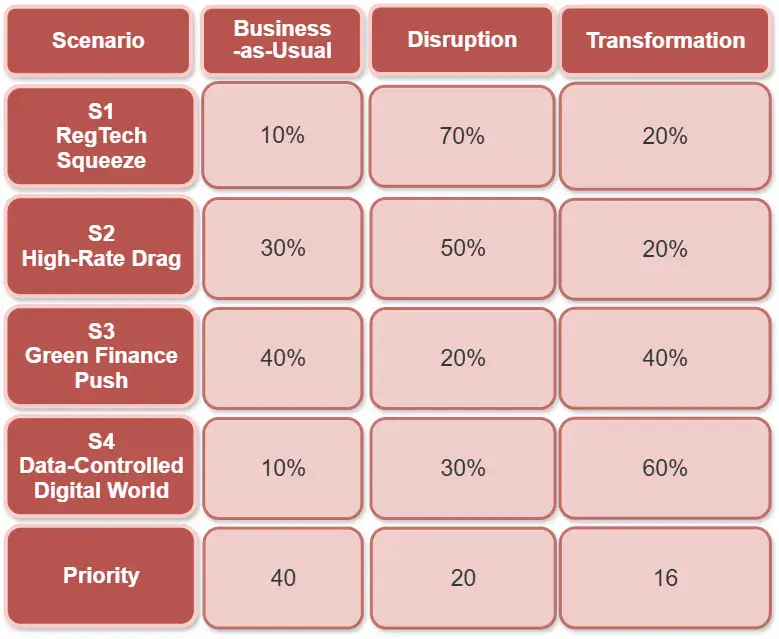
-
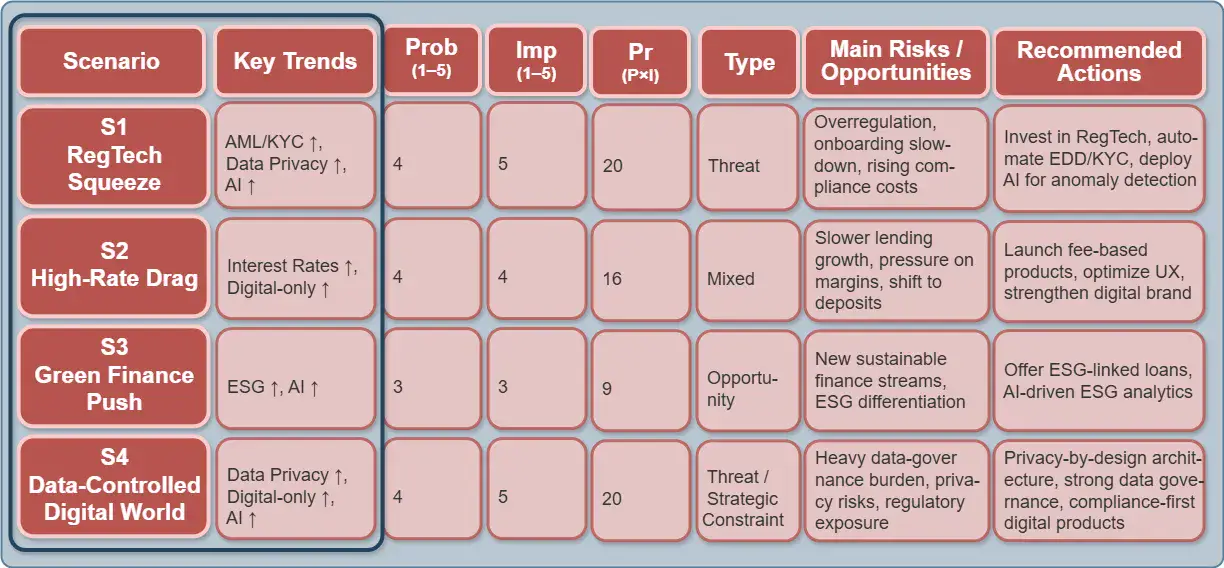
Probability (1–5)
— the total impact of a trend on other factors → indicates who “drives the system.”
-
Impact (1–5)
— strength of impact on the project;
-

Type
— Opportunity / Threat / Mixed;
-

Priority
= P × I — priority for monitoring.

-

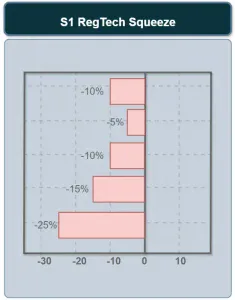
Regulatory Pressure (S1)
— the zone of maximum risk, requiring immediate adaptation of architecture, AML/KYC processes, and RegTech.
-

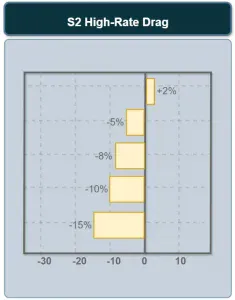
High Interest Rates (S2)
— a scenario of managed uncertainty, affecting lending and deposit strategy.
-

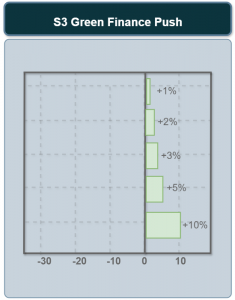
ESG and AI Transformation (S3)
— a window of long-term opportunities and strategic positioning.
-

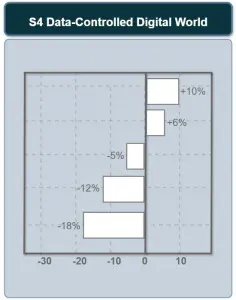
Data-Controlled Diital World (S4)
— a foundational constraint defining requirements for IT architecture, data, and compliance across all scenarios.

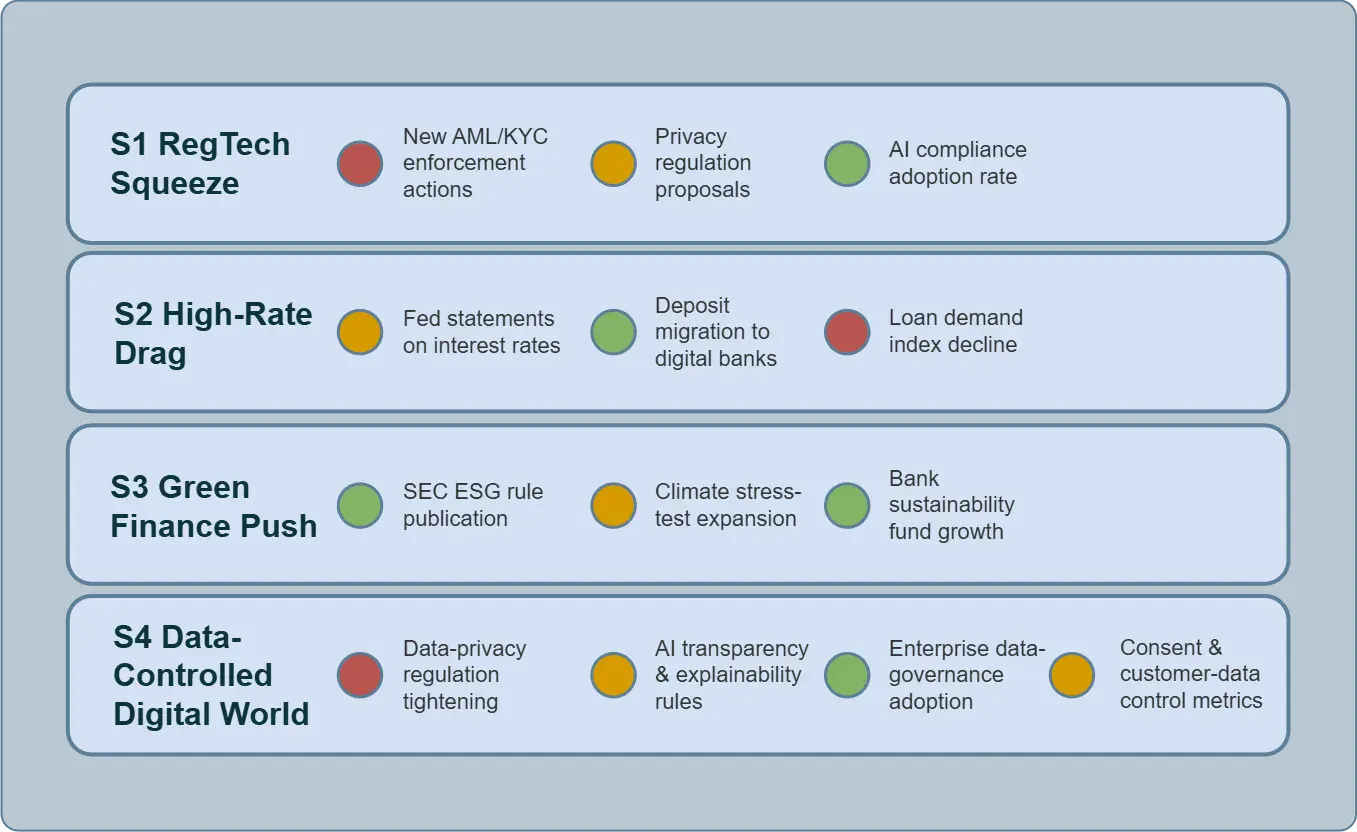
What it Shows:
Indicators that need to be monitored in real time for early detection of a scenario.
RAG color coding:
 Critical — the signal is active (e.g., new AML sanctions).
 Caution — the trend is strengthening (e.g., climate stress tests).
 Stable — control factors are within normal range.
-

PESTEL Table + Dashboard
→ shows the environmental context and pressure.
-

Trend Matrix + Trend Cards
→ shows trajectories of change.
-

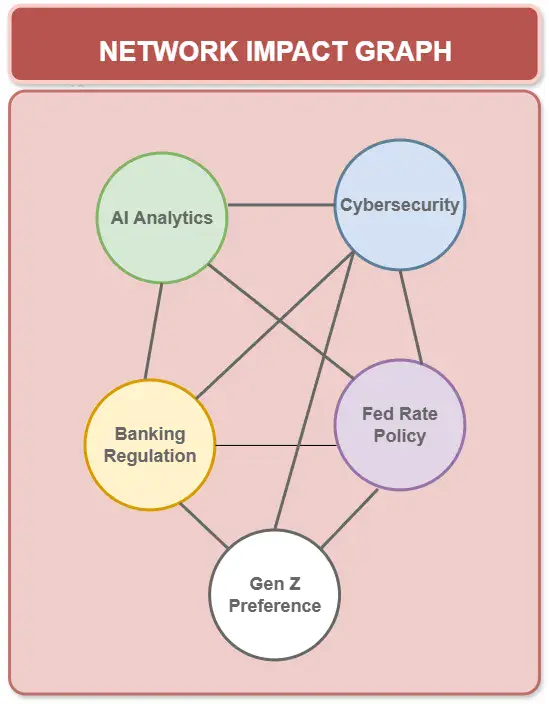
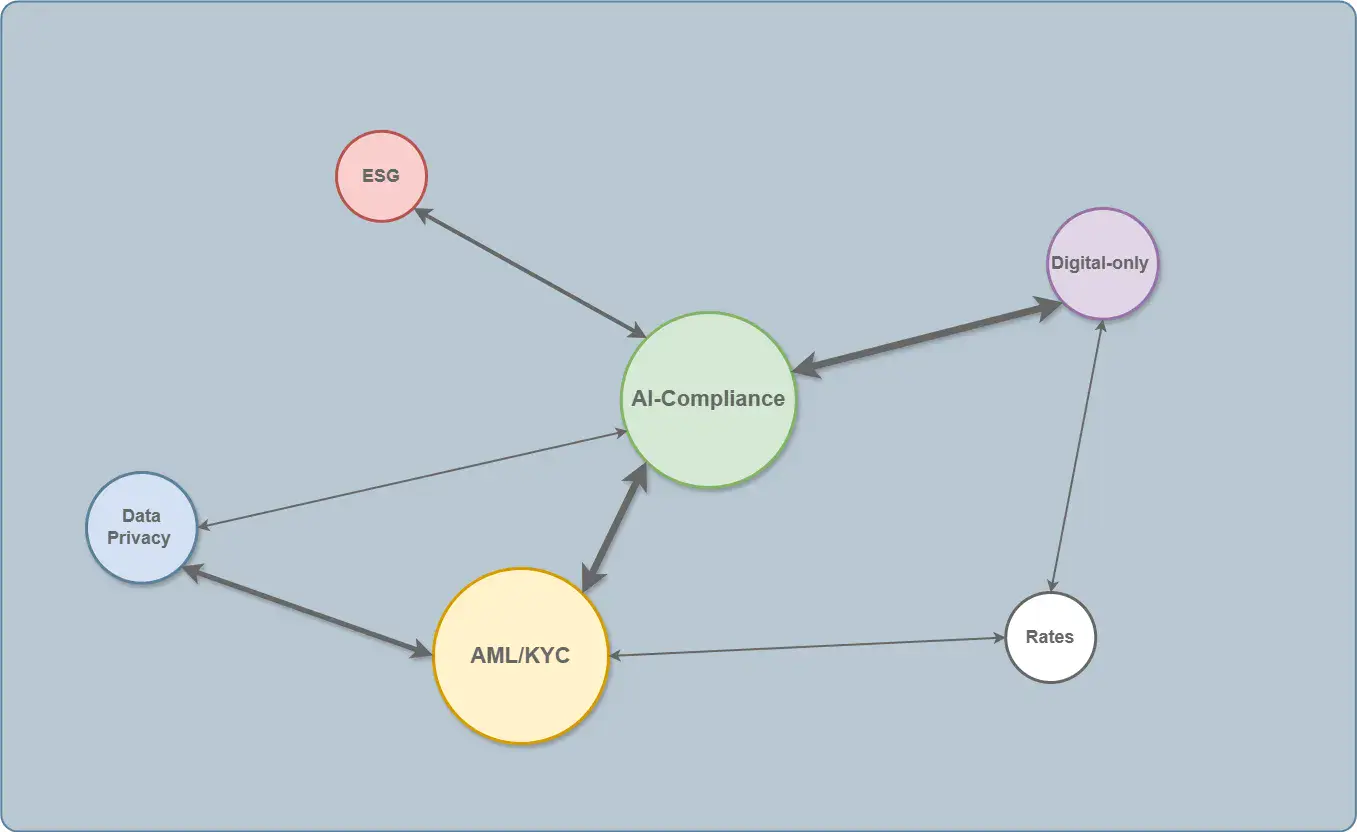
Cross-Impact Matrix + Network Graph
→ shows mutual influence between trends.
-
Sensitivity Tables + Scenario Mapacy ↑
→ shows scenario priorities for action.


