


-

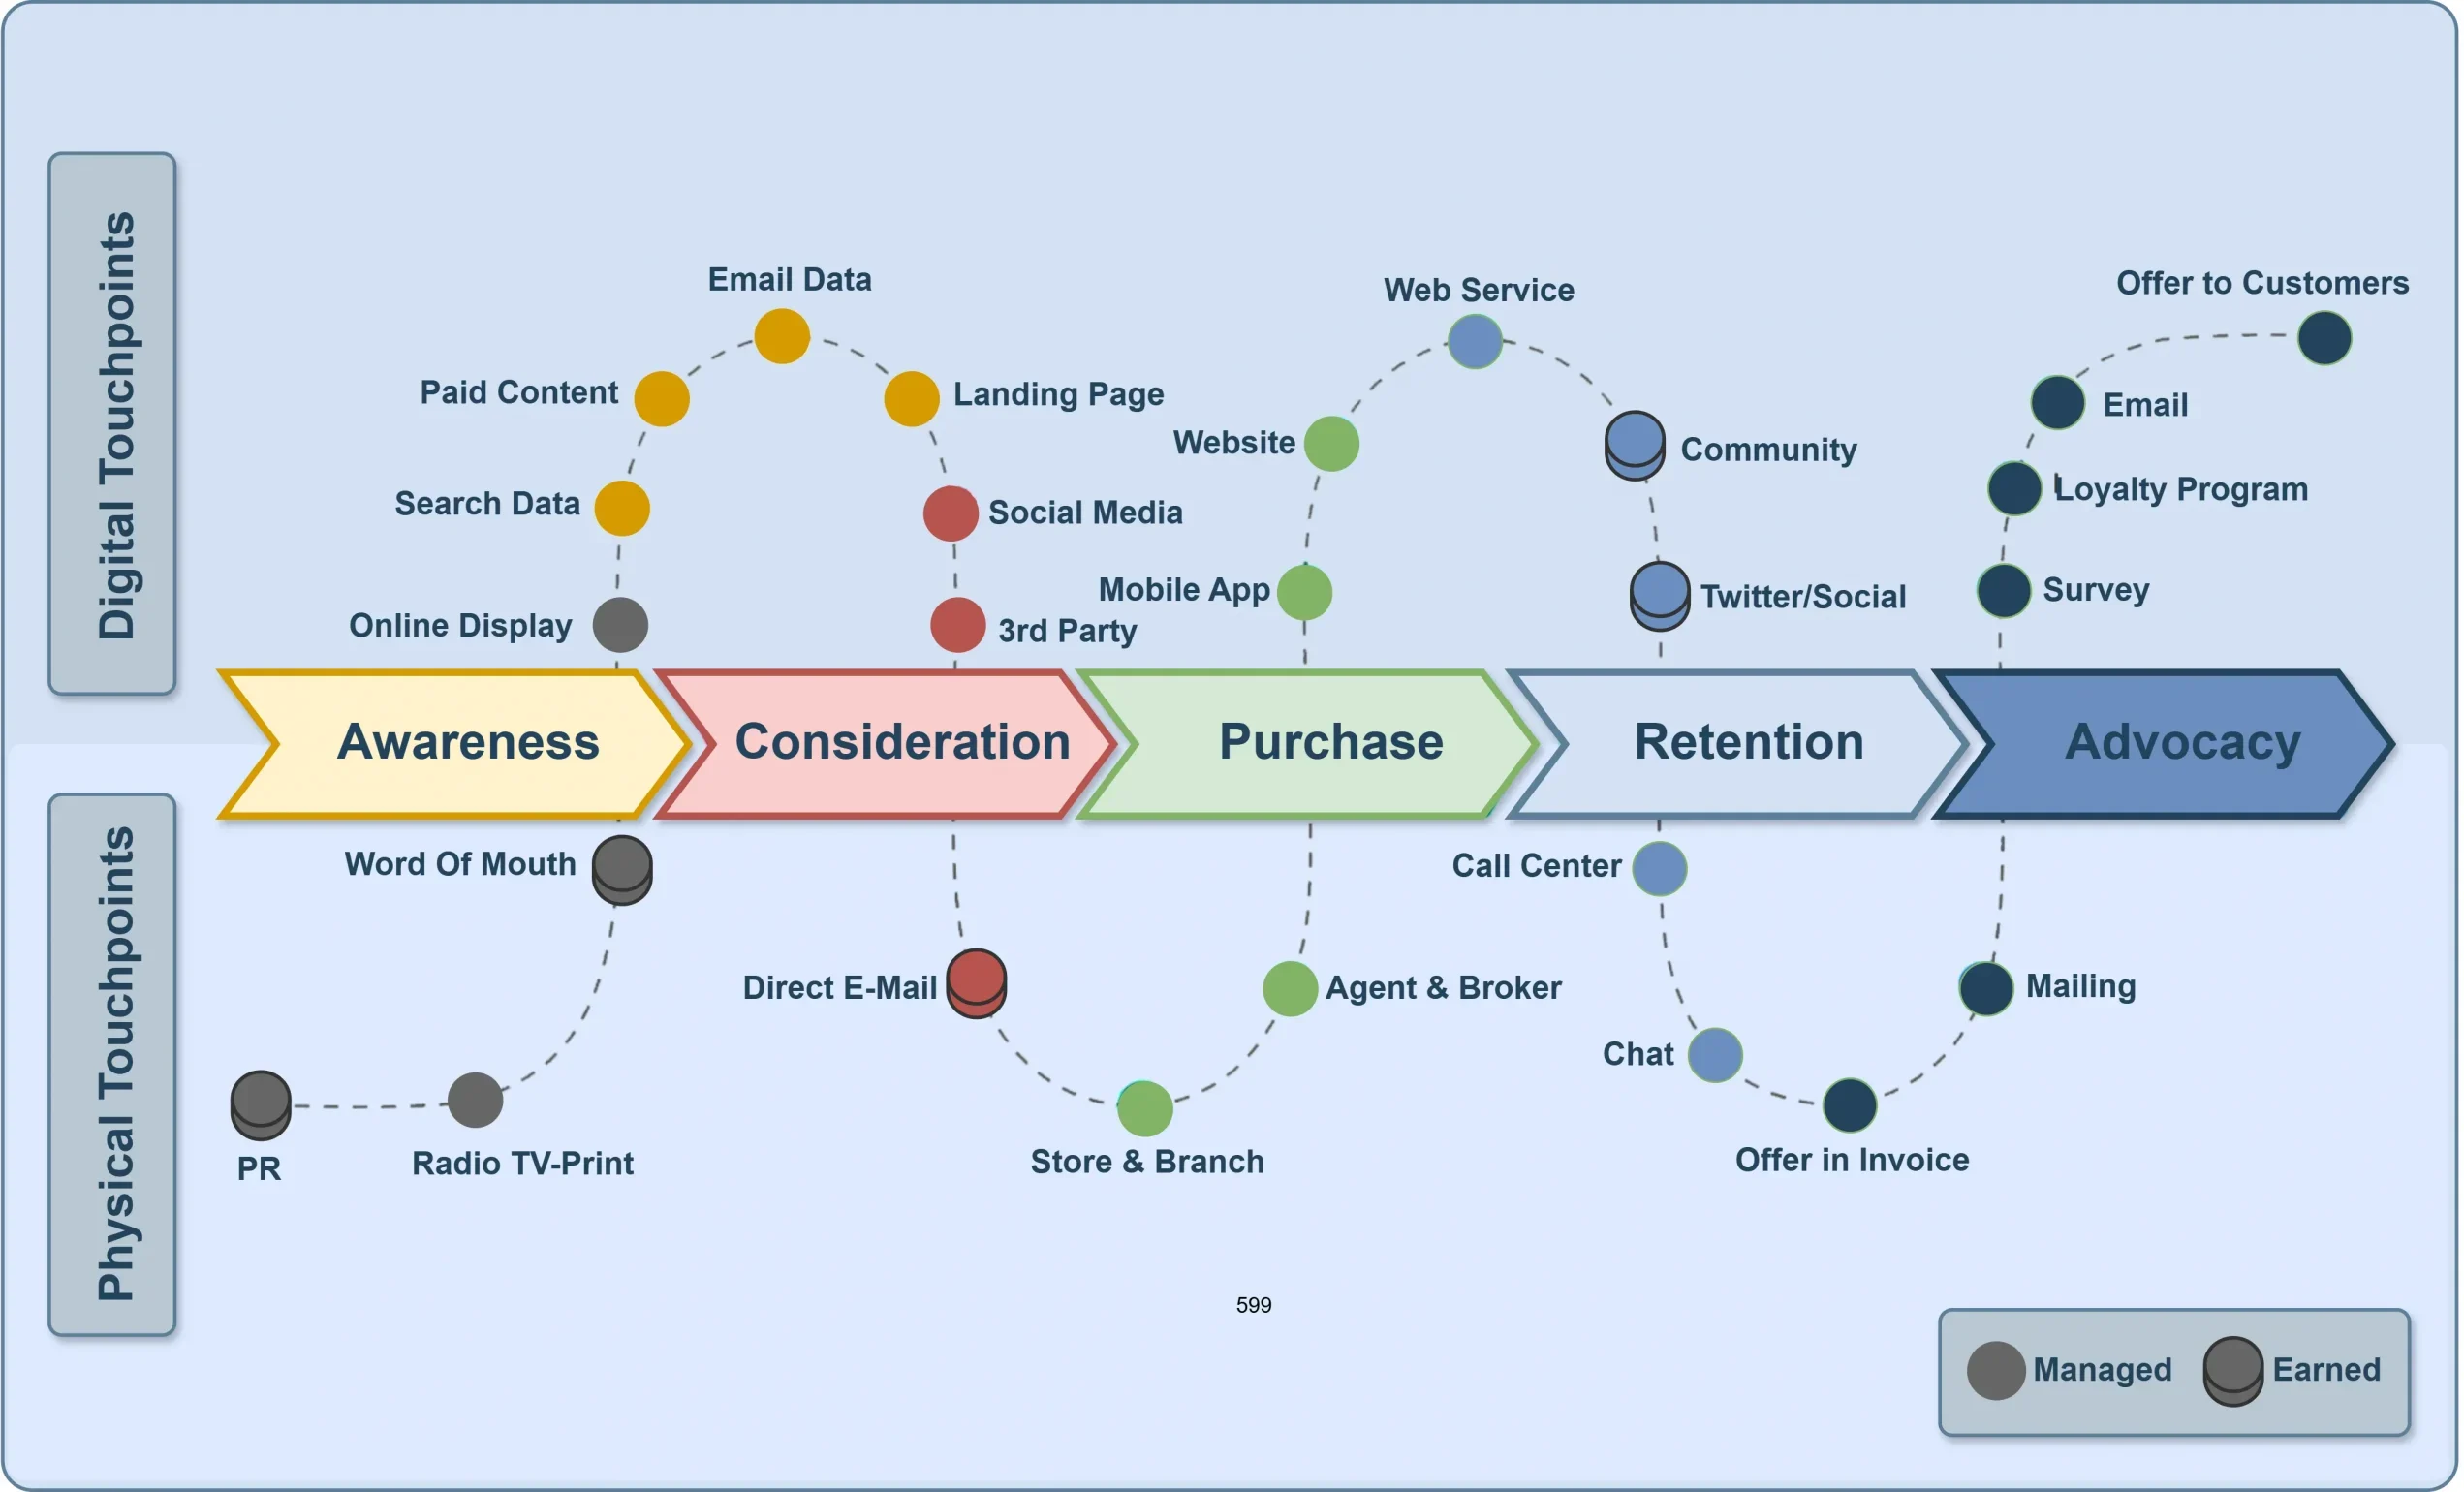
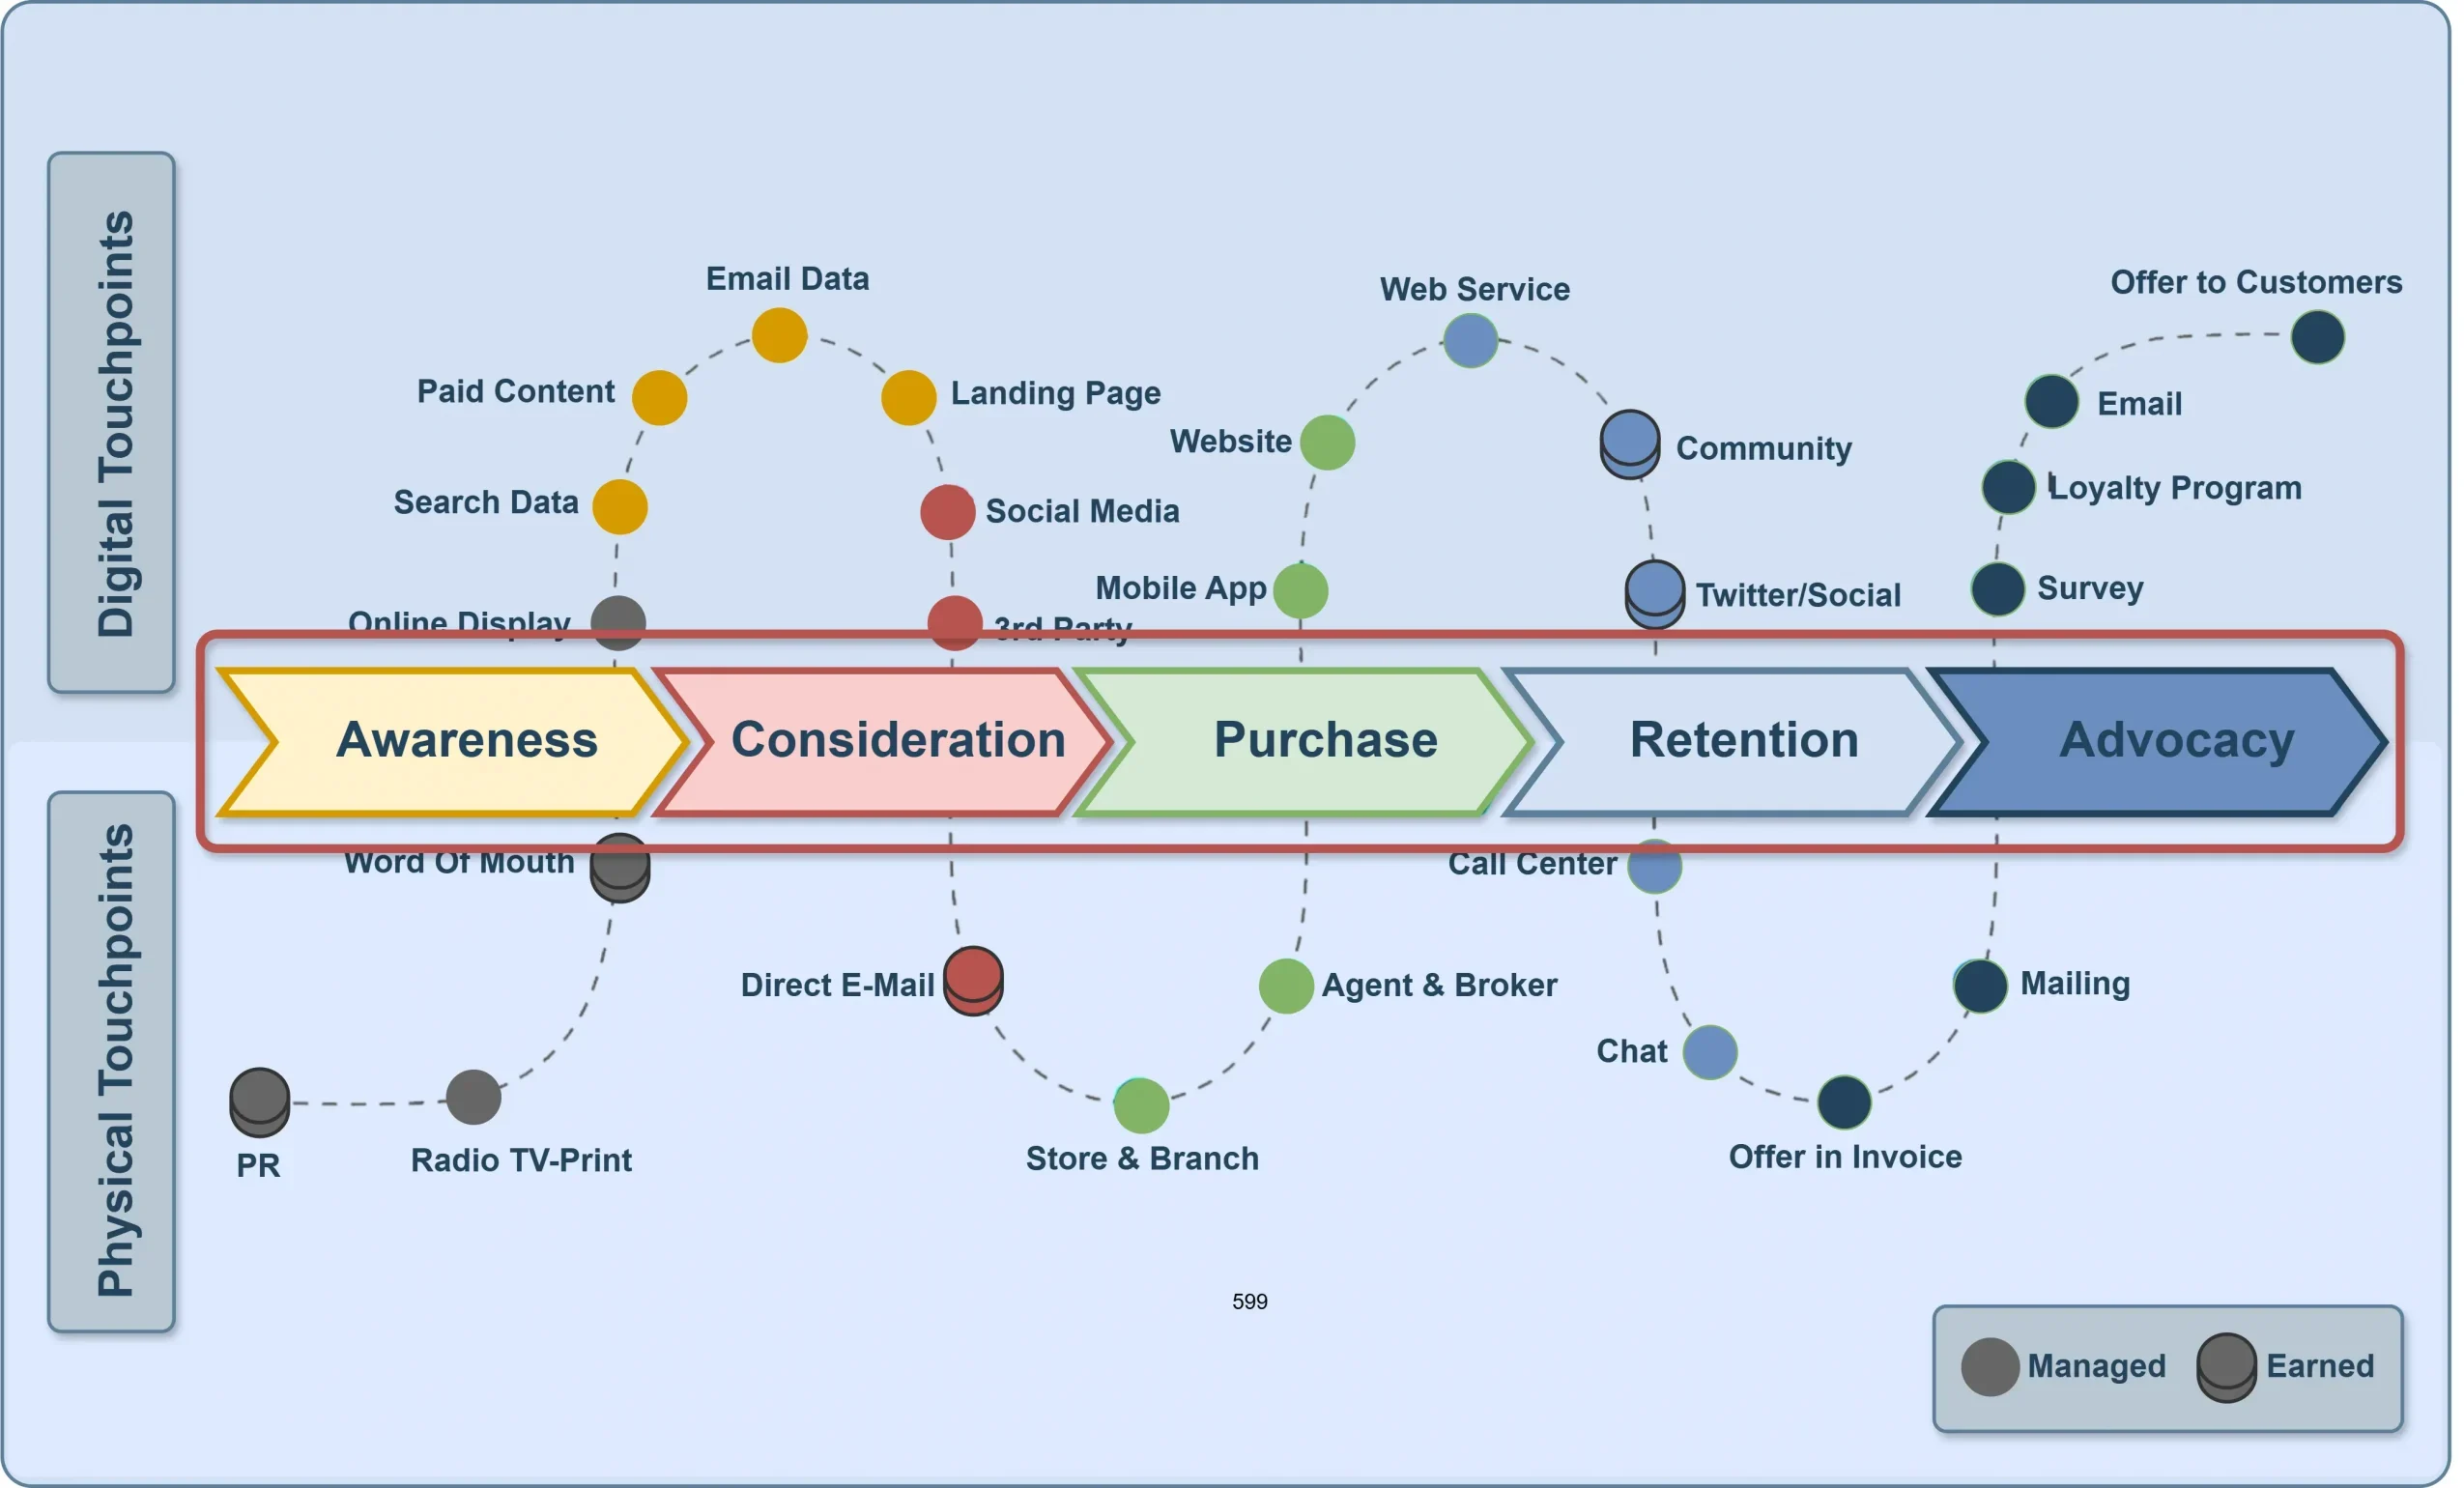
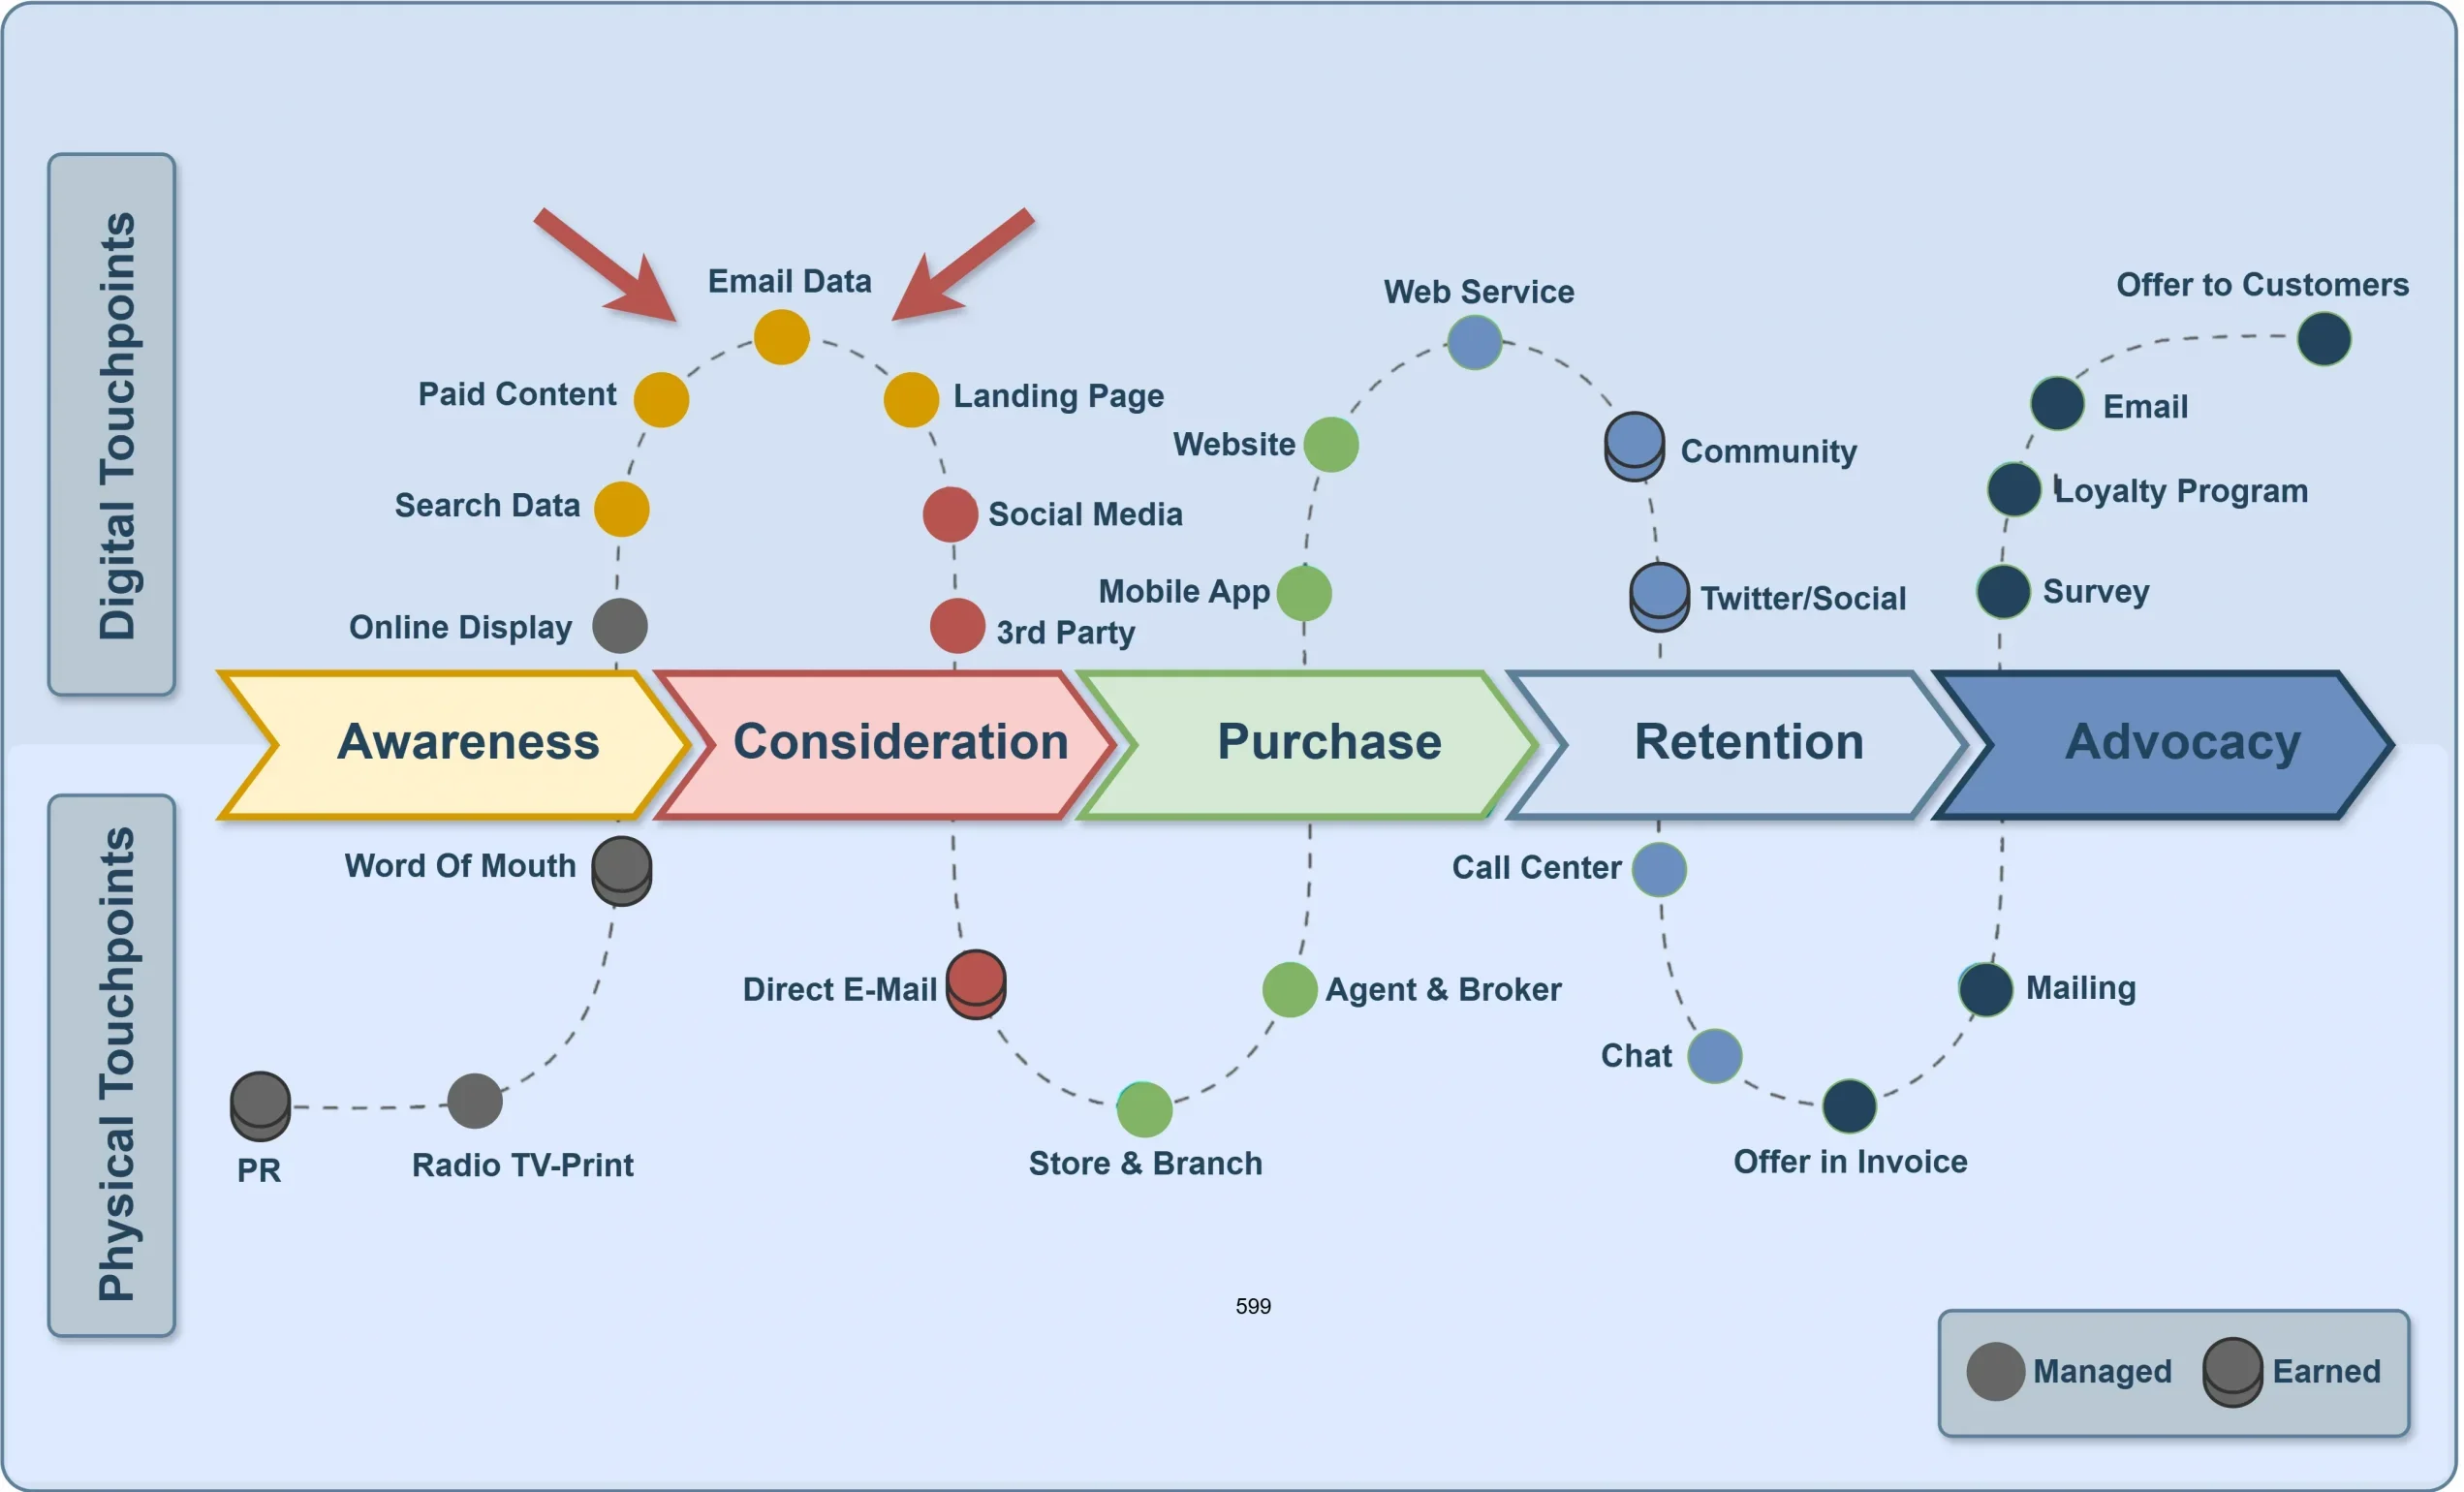
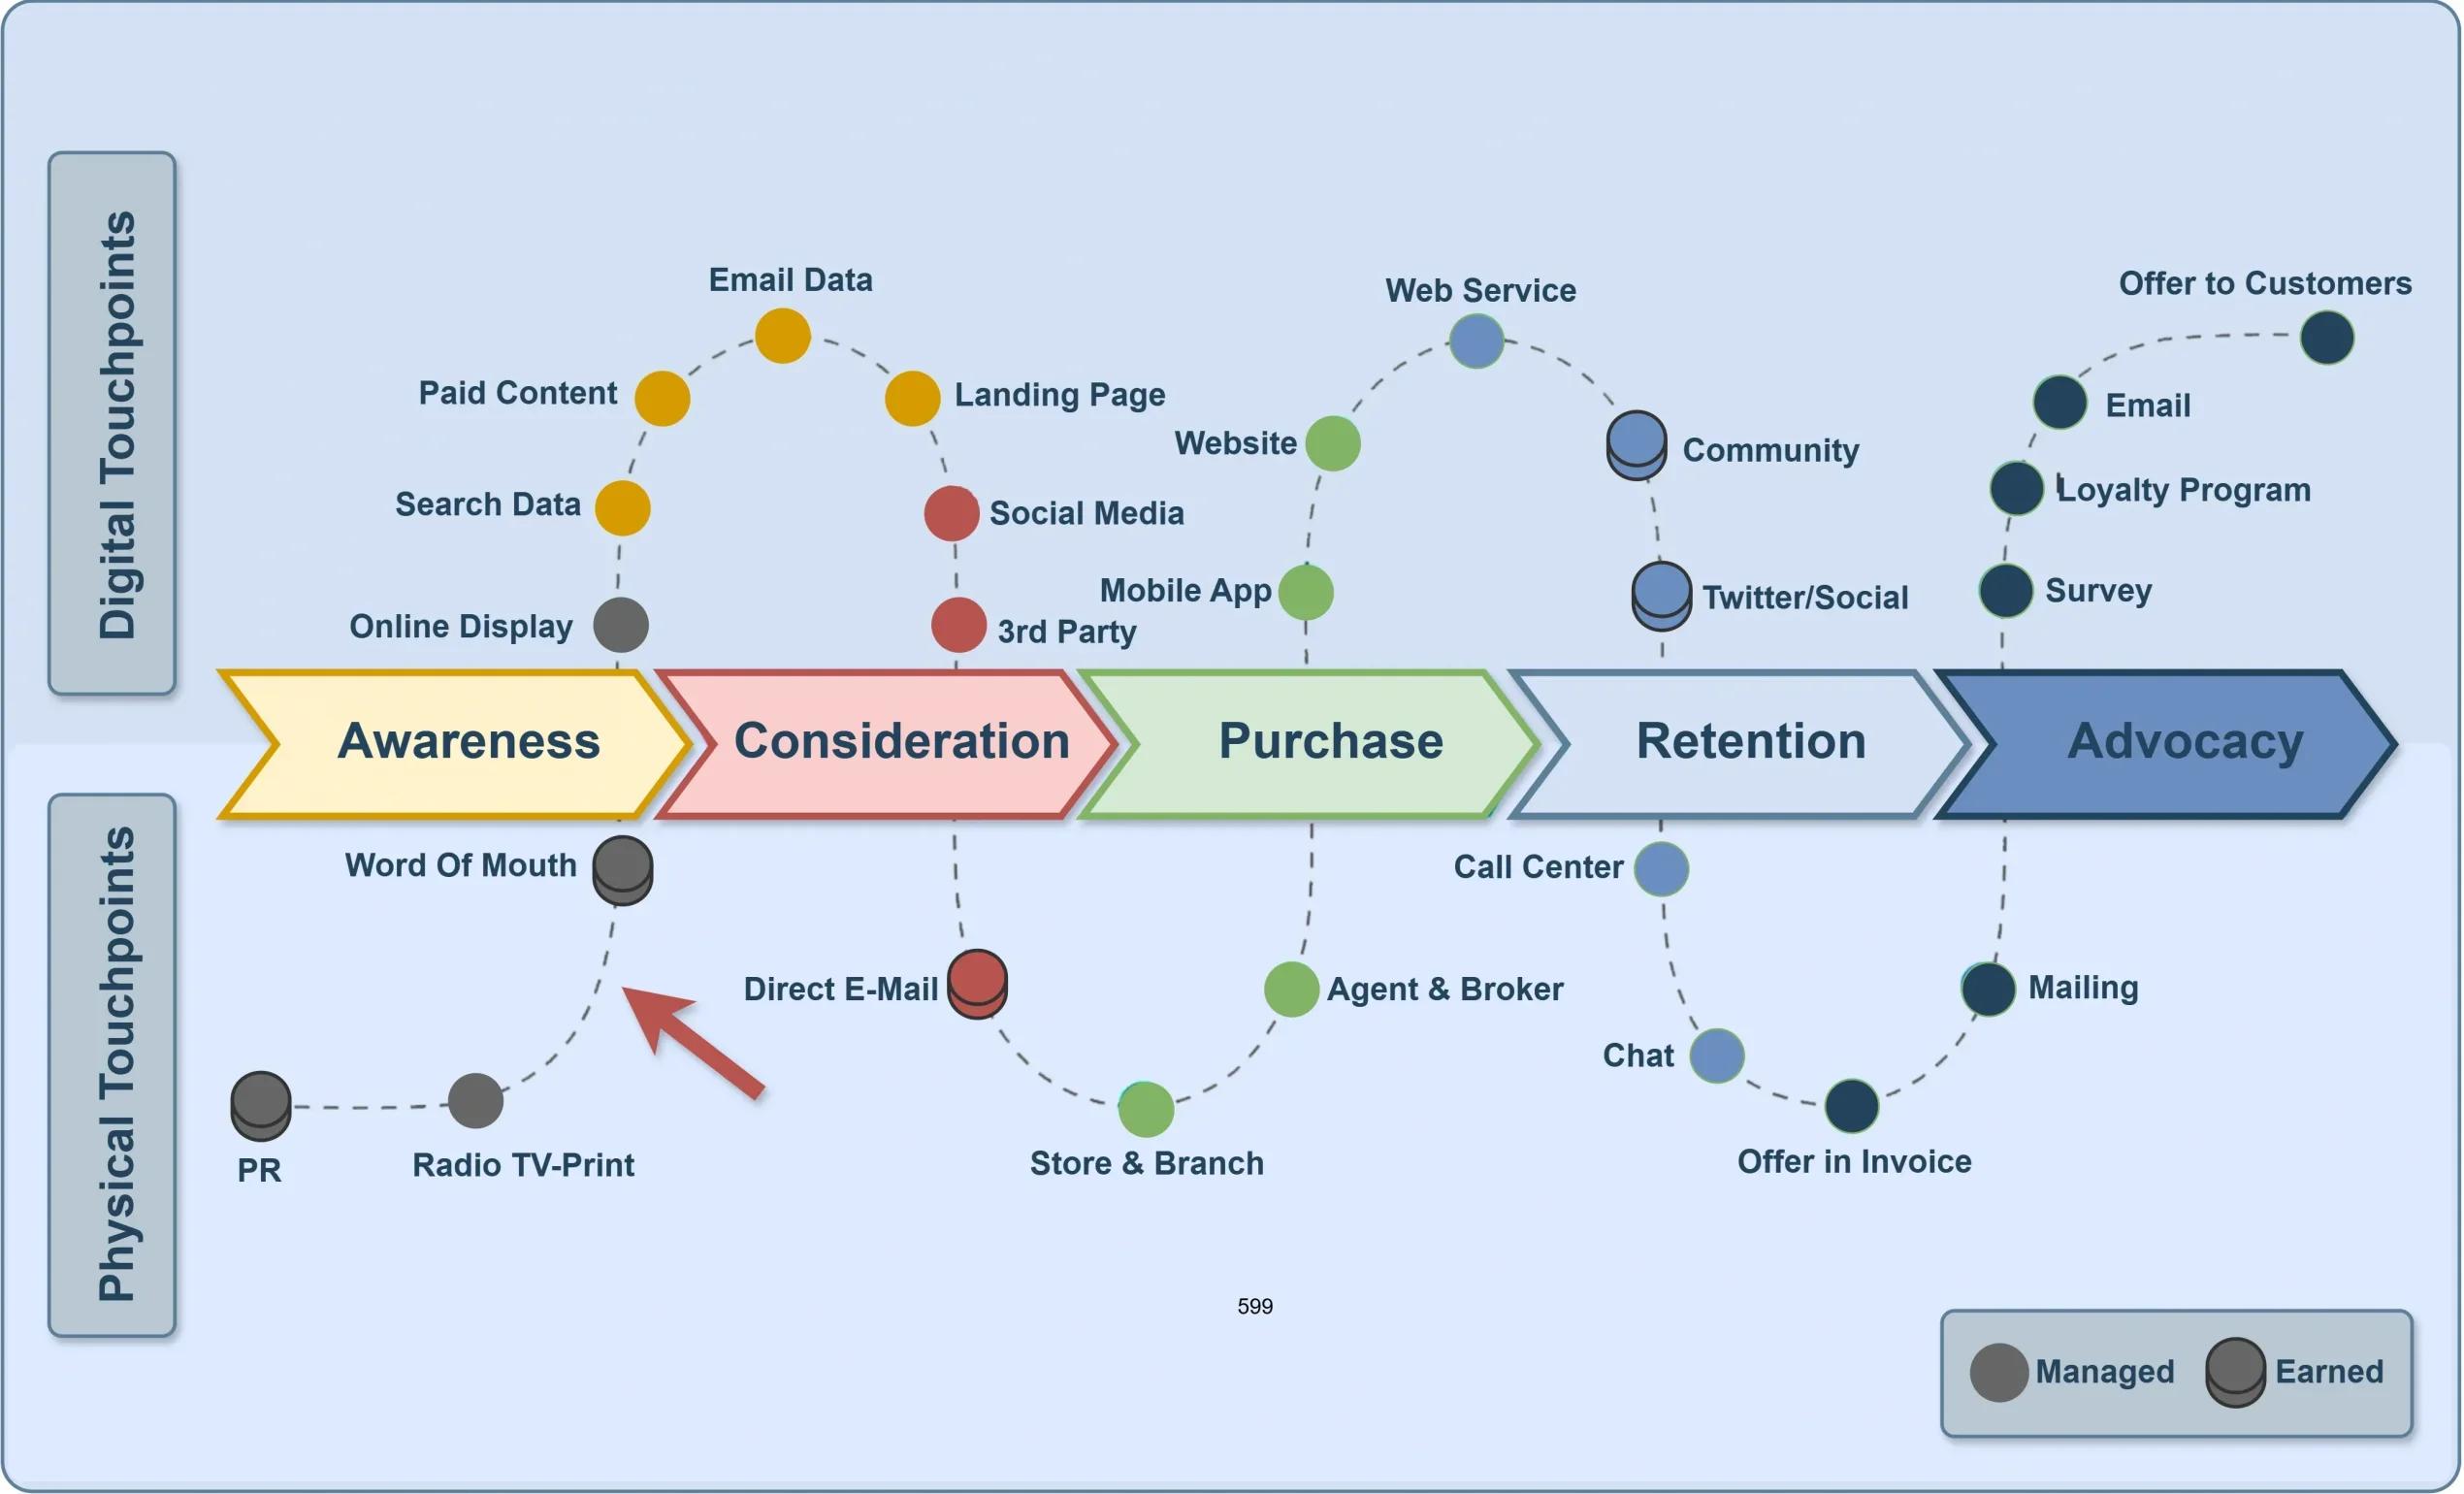
Social & Media: #
TikTok Ads, YouTube Shorts, Influencer Reels, Reddit threads.
-

Owned Channels: #
Website, App Store page, Mobile app, AI chat assistant, Push notifications.
-

Engagement & Retention: #
Email automation, Loyalty programs, Referral bots, Gamified dashboards.
-

Emerging Channels: #
Web3 wallet integration, AI-powered credit assistant, Telegram/Discord finance communities.
-

Events & PR: #
financial seminars, PR conferences, collaborations with lifestyle venues.
-

Experience Zones: #
pop-up spaces in shopping malls, VR demos, co-working banking points.
-

Customer Service: #
agent locations, call centers, face-to-face consultations.
-

Community: #
partner events, charity initiatives, sports sponsorships.

-

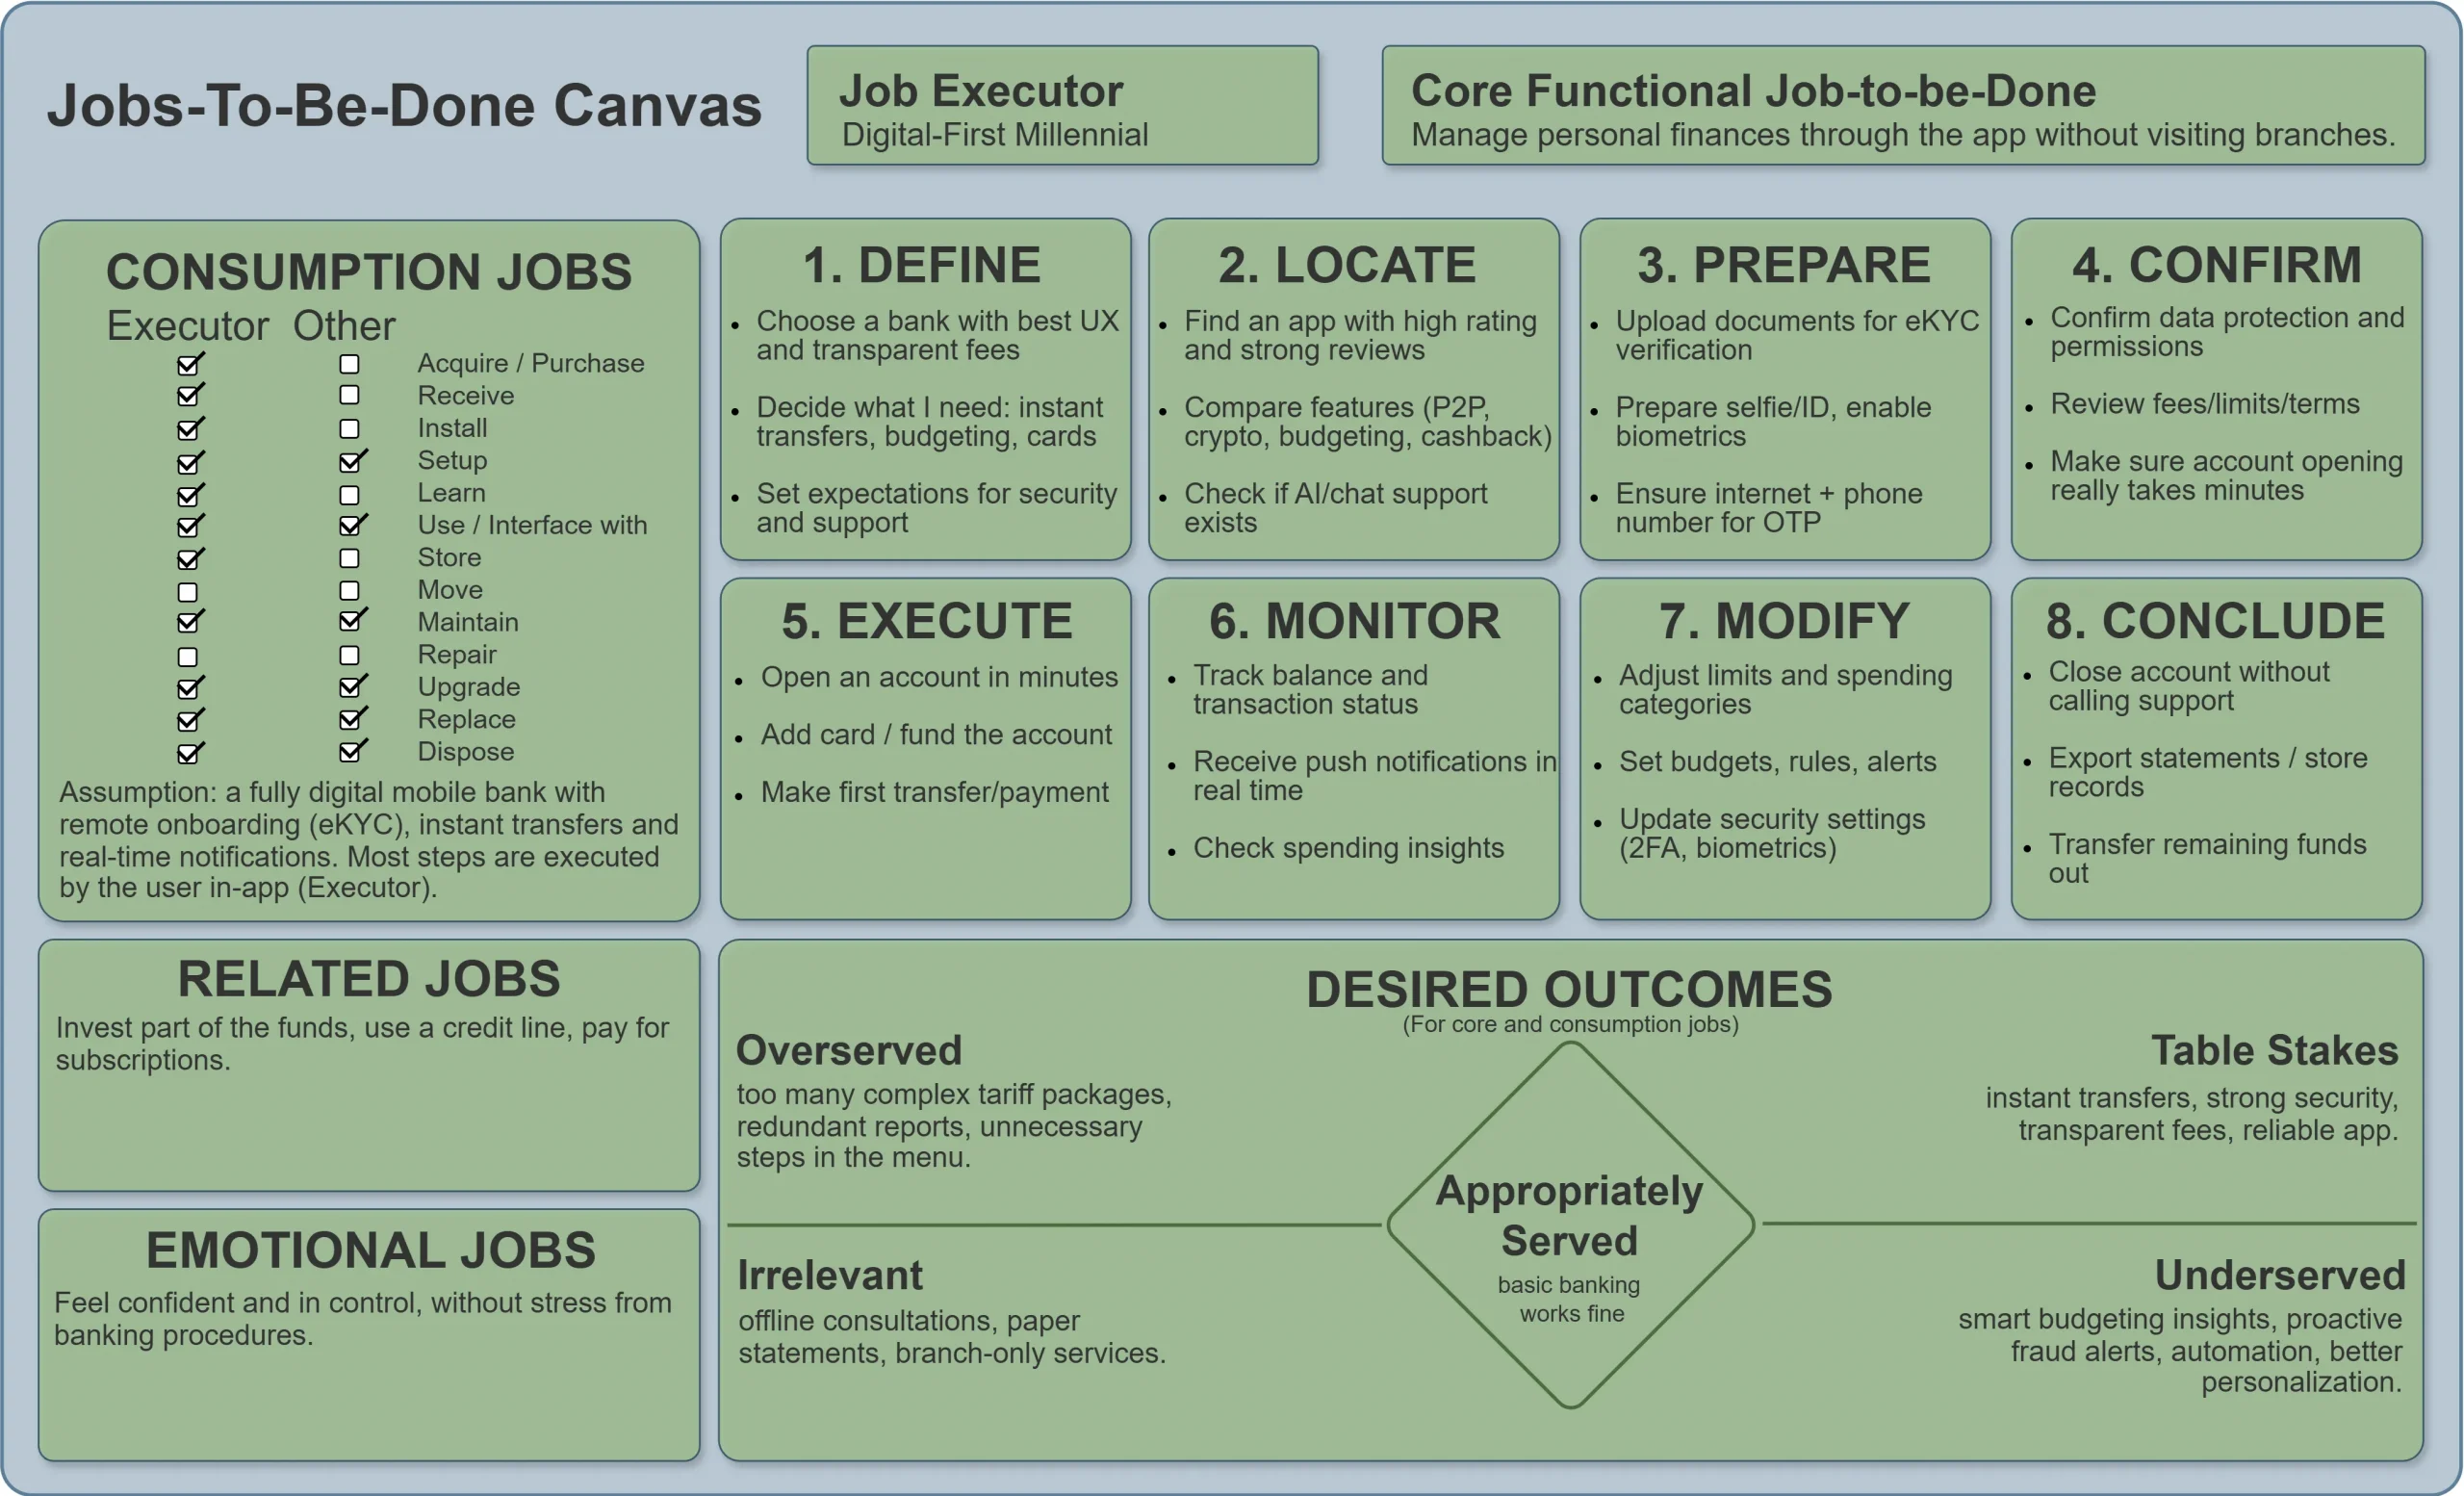
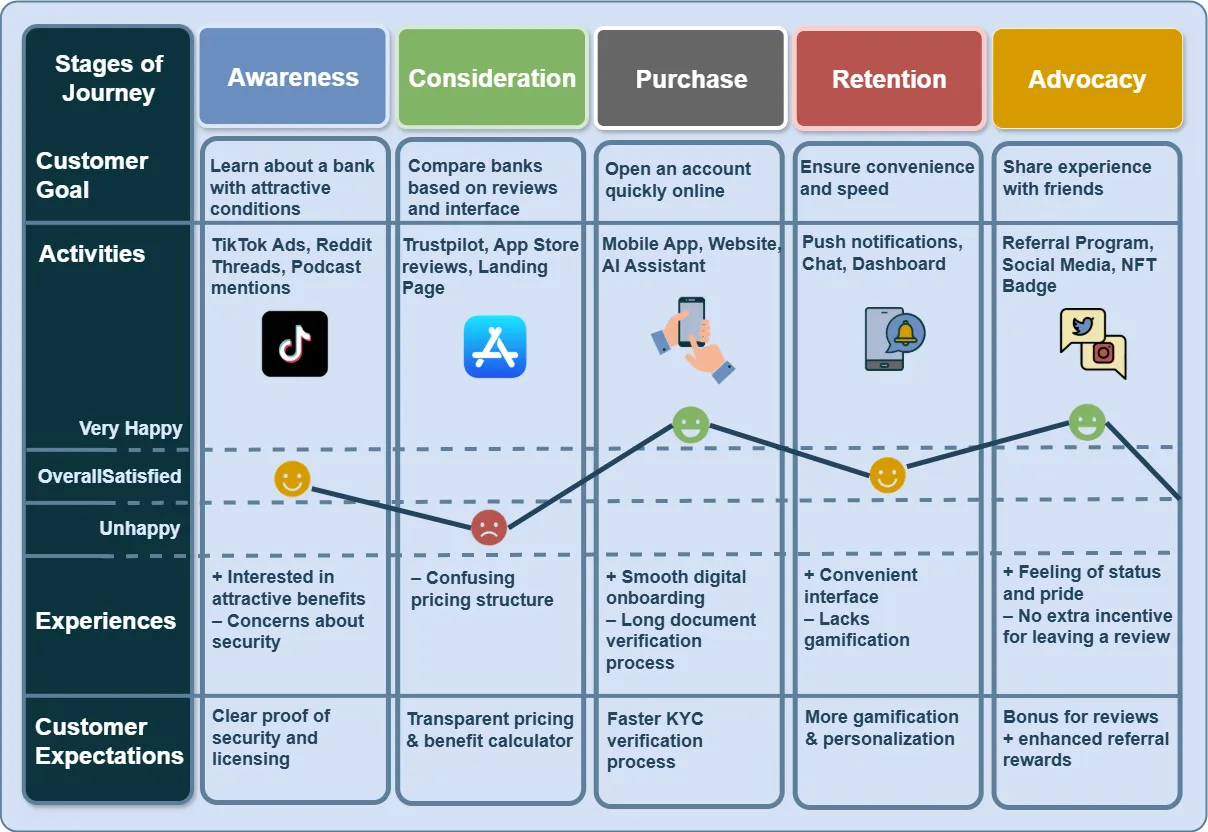
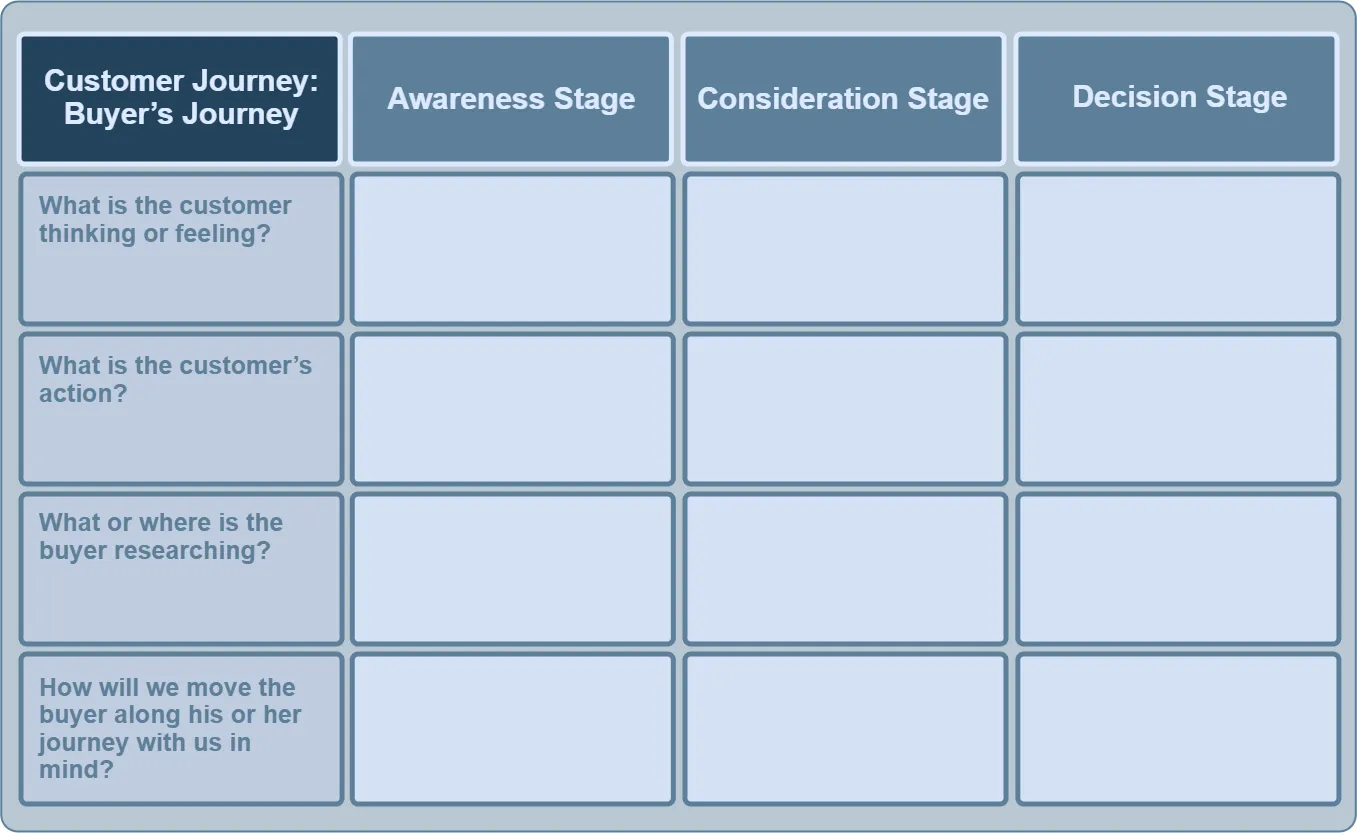
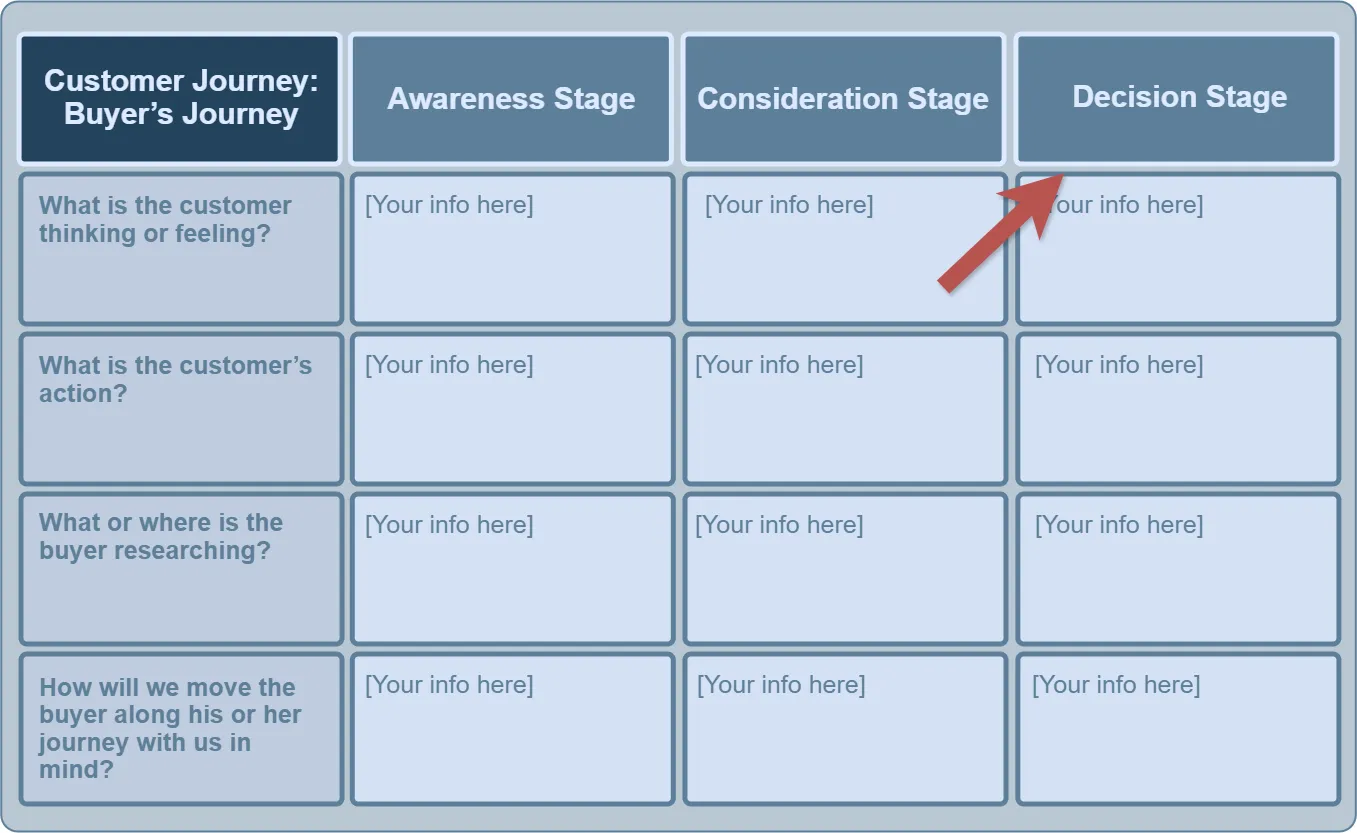
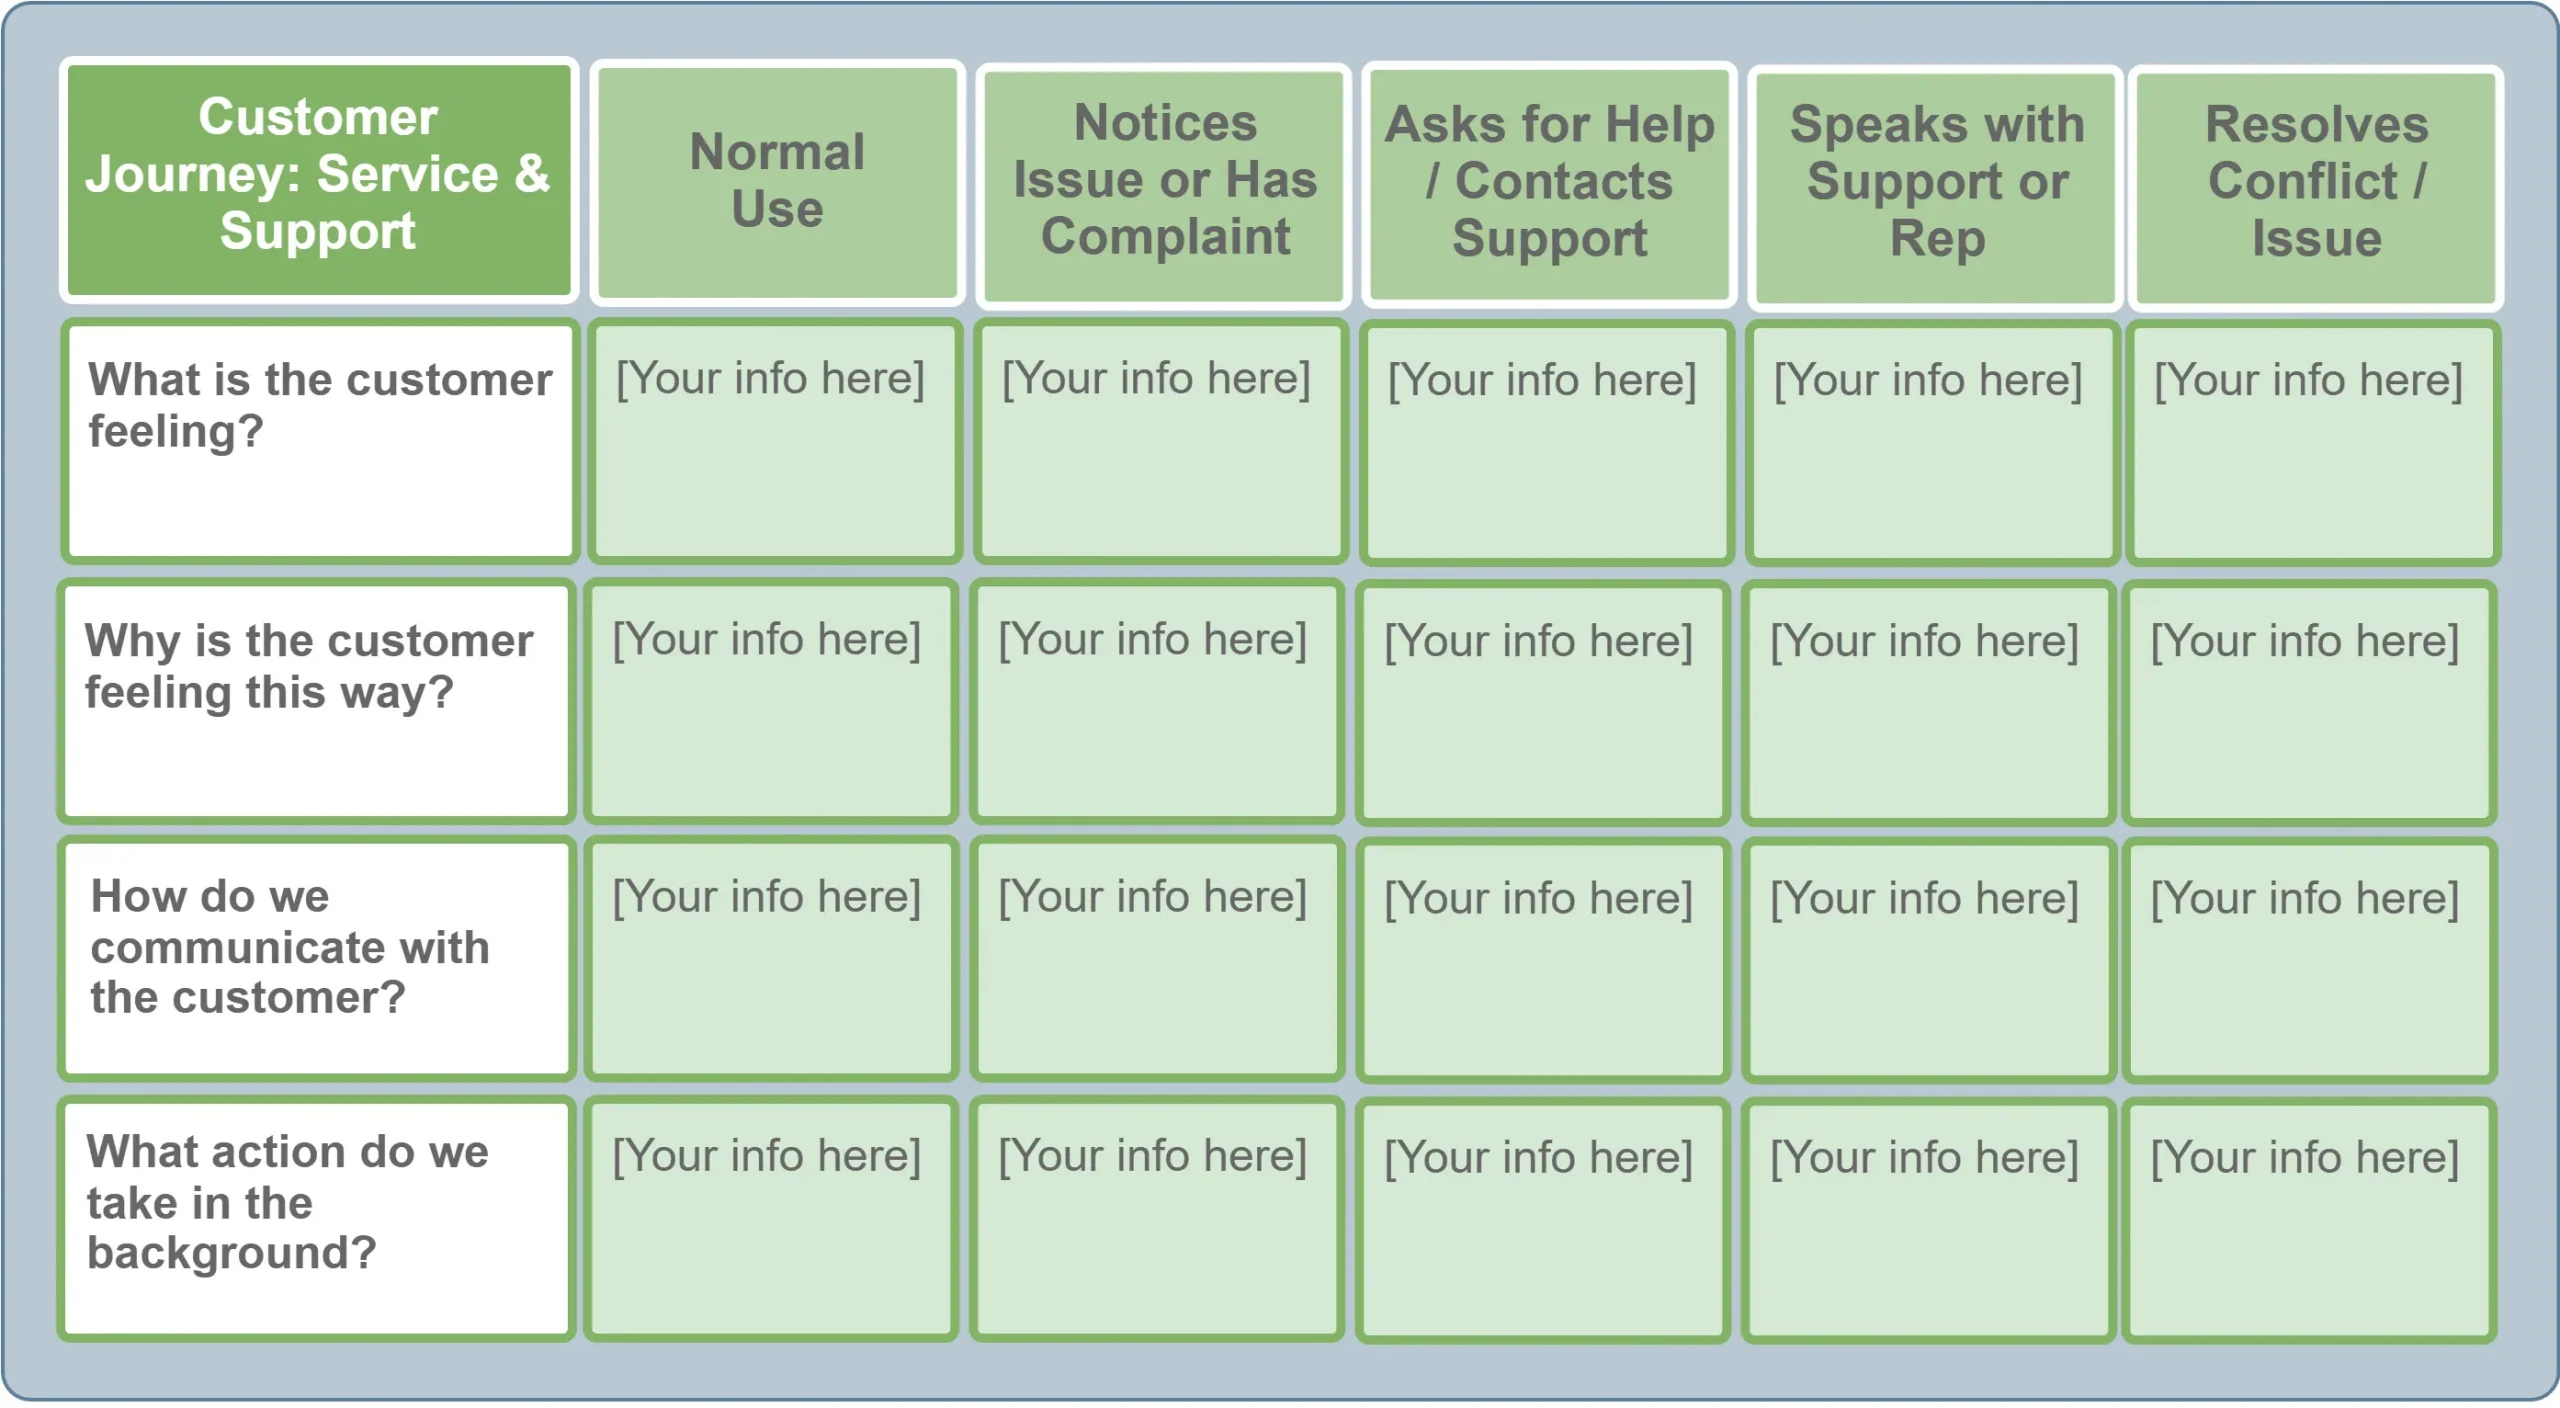
What is the customer feeling? #
Defines the customer’s emotions at each stage (calm, frustration, hope, satisfaction).
-

Why is the customer feeling this way? #
Clarifies the reason: complex interface, delayed response, unclear instructions, data loss, etc.
-

How do we communicate with the customer? #
Communication format: chatbot, email, phone call, callback, video assistance.
-

What action do we take in the background? #
Describes internal processes — escalations, automation, log analysis, ticket prioritization.

-
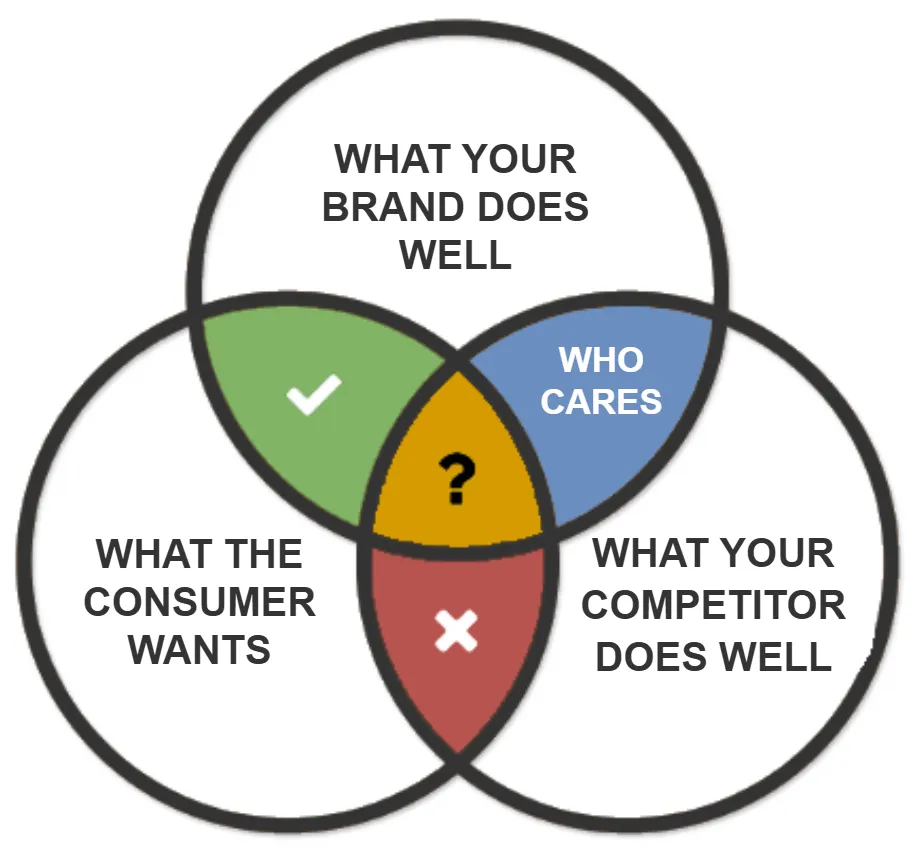
Winning Zone #
Clear point of difference that meets the needs. make it even bigger.
-
Losing Zone #
Your copetitor meets the consumer needs better then you do. you'll be crushed.
-
Risky #
Competitive battle ground. use emotion, innovative, su- perior execution.
-

Who Cares #
Many times, competitors battle in areas the consumer just doesn't care about. Have fun wasting your time.
-

Winning Zone #
— the area of strong differentiation that addresses a significant customer need;
-

Risky Zone #
— a zone of competitive equilibrium that requires innovation or emotional differentiation;
-

Losing Zone #
— the area where competitors satisfy customer needs better;
-
Who Cares #
— aspects that are not important to the customer and do not create value.


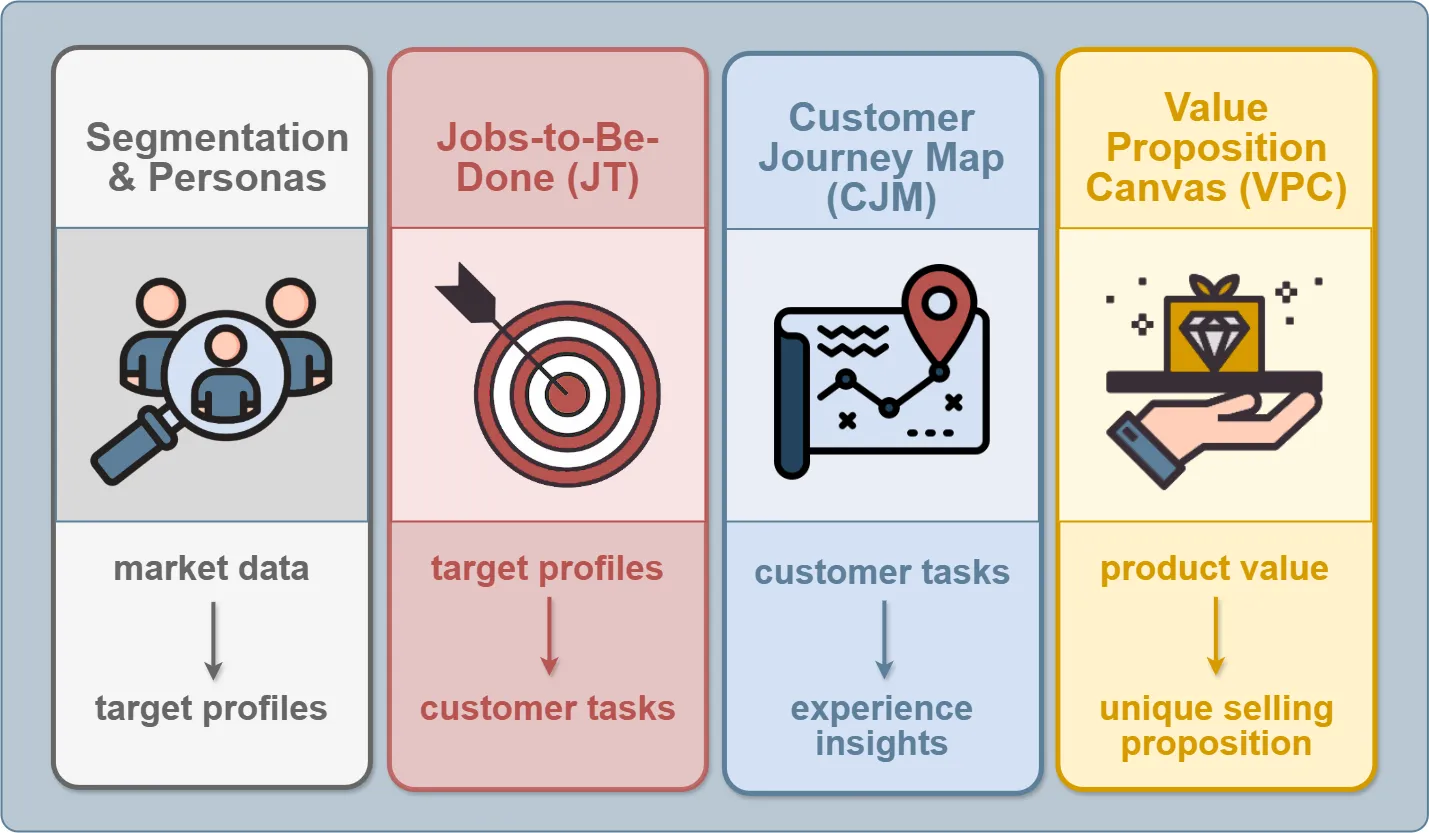
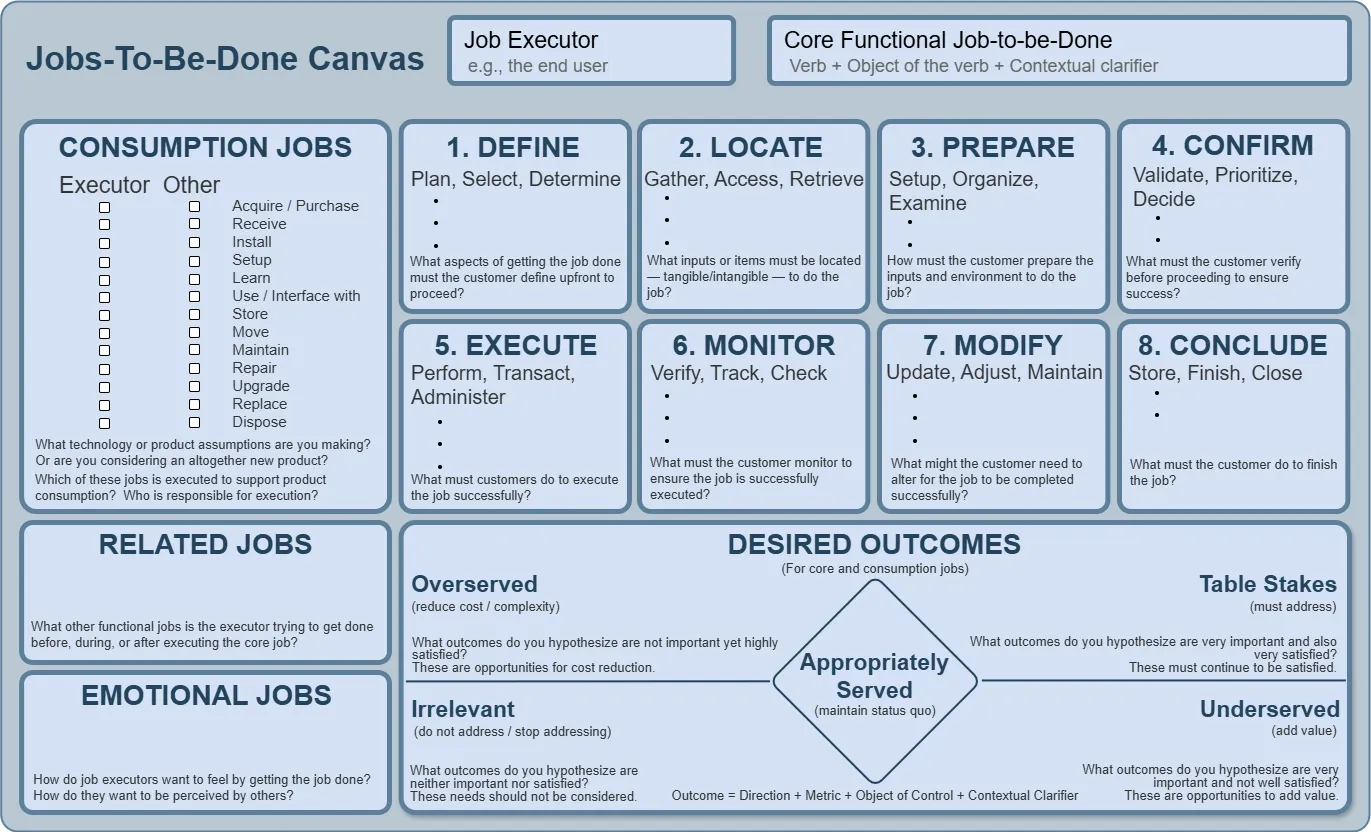
Where can we win?

How do we create and deliver this value?

Where does the customer experience this value?


From Strategic Intent
to Value Design
to Customer Experience


(Analytical Layer)
(Strategic Communication Layer)

(Operational Communication Layer)

From internal logic
to strategic essence
to market expression


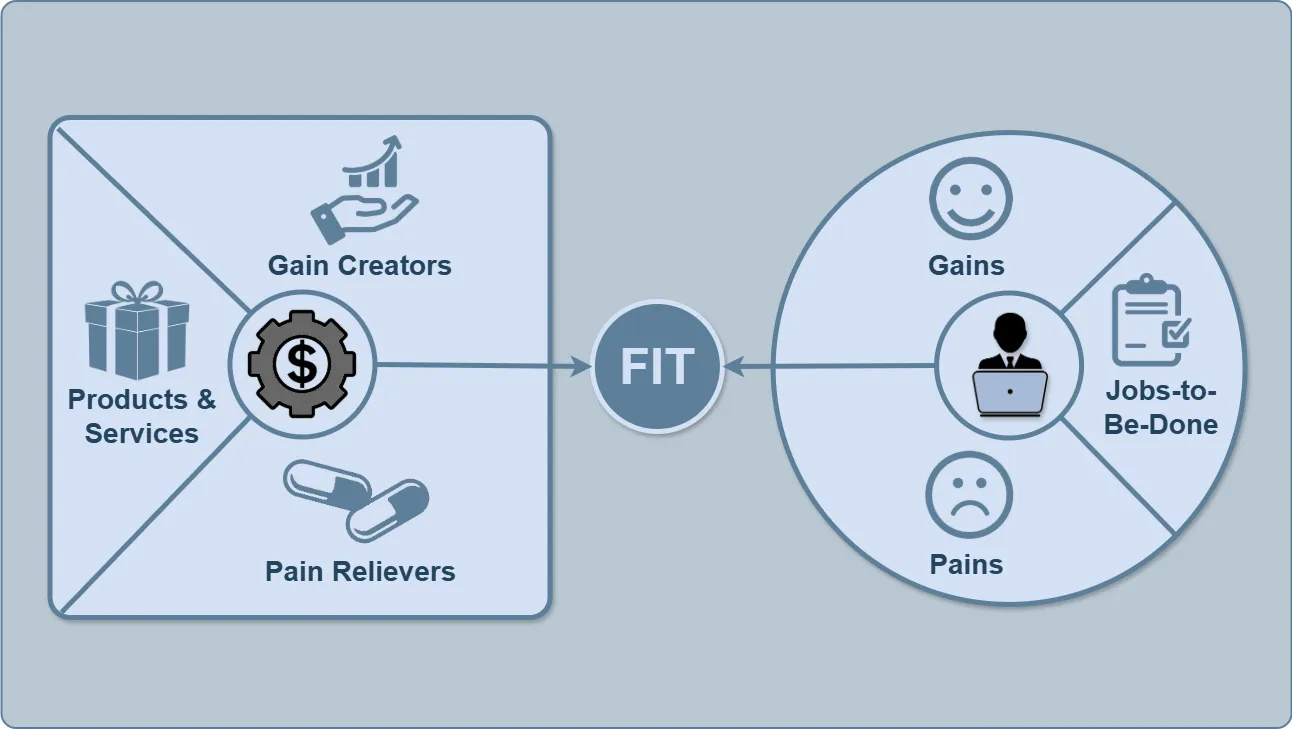
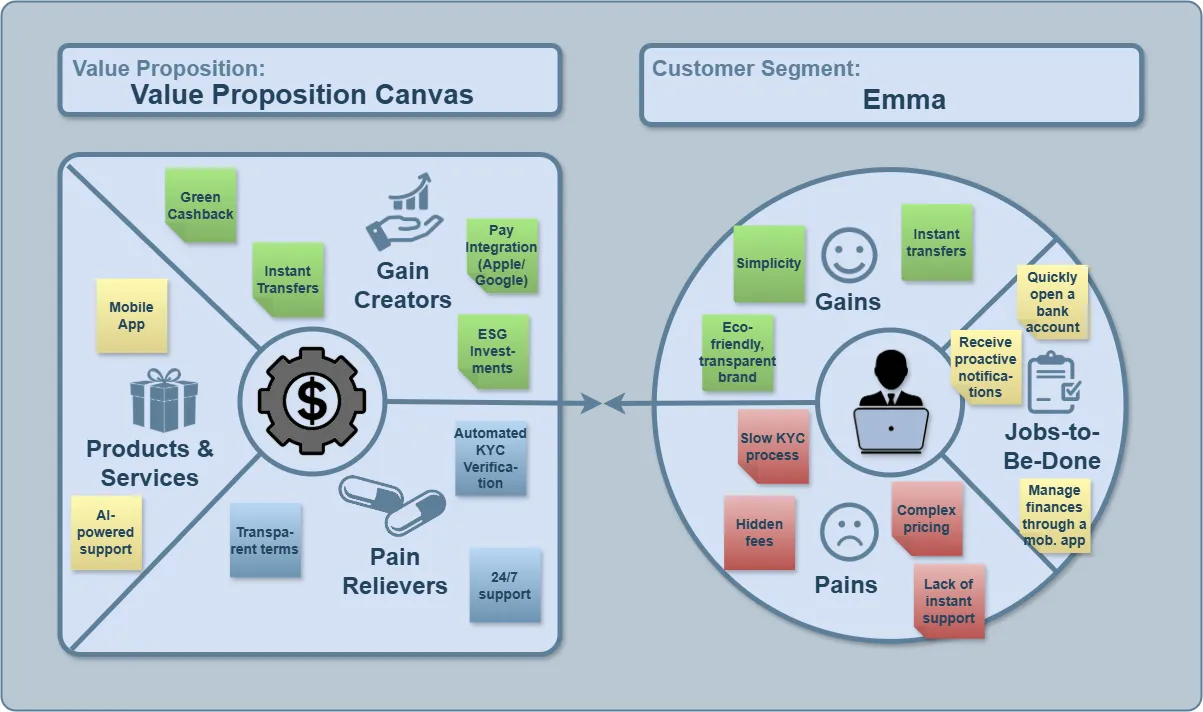
(Jobs / Pains / Gains)
(Products / Relievers / Creators)
(FIT)


