
Topic Definitions
RACI Matrix

RACI Matrix
A responsibility assignment matrix that helps clarify roles and responsibilities in a project. It’s often difficult for beginners to understand all the components, so it might be helpful to explain how RACI helps to define who is Responsible, Accountable, Consulted, and Informed.
PESTEL Analysis

PESTEL Analysis
A tool used to assess the external environment by analyzing Political, Economic, Social, Technological, Environmental, and Legal factors.
JTBD
Jobs To Be Done
A framework that focuses on understanding customer needs by identifying the “job” they are trying to complete with a product or service.
PII

Personally Identifiable Information
It is any information that can be used to identify a specific individual.
SWOT

Strengths, Weaknesses, Opportunities, Threats
It is a strategic tool for assessing internal and external factors that impact an organization or project.
PEST

Political, Economic, Social, Technological
A model for analyzing the external environment that covers political, economic, social, and technological factors that may impact a project or organization.
Strategy Synthesis

Strategy Synthesis
It is the process of combining different strategic directions and approaches into a single overall strategy, which enables the effective use of available resources and efforts to achieve the goals of a project or organization.
SWOT Analysis

SWOT Analysis
It is a specific process that applies the SWOT model to analyze the situation in a company, project, or any other organization.
RACI Matrix
A responsibility assignment matrix that helps clarify roles and responsibilities in a project. It’s often difficult for beginners to understand all the components, so it might be helpful to explain how RACI helps to define who is Responsible, Accountable, Consulted, and Informed.
PESTEL Analysis
A tool used to assess the external environment by analyzing Political, Economic, Social, Technological, Environmental, and Legal factors.
Jobs To Be Done
A framework that focuses on understanding customer needs by identifying the “job” they are trying to complete with a product or service.
Personally Identifiable Information
It is any information that can be used to identify a specific individual.
Strengths, Weaknesses, Opportunities, Threats
It is a strategic tool for assessing internal and external factors that impact an organization or project.
Political, Economic, Social, Technological
A model for analyzing the external environment that covers political, economic, social, and technological factors that may impact a project or organization.
Strategy Synthesis
It is the process of combining different strategic directions and approaches into a single overall strategy, which enables the effective use of available resources and efforts to achieve the goals of a project or organization.
SWOT Analysis
It is a specific process that applies the SWOT model to analyze the situation in a company, project, or any other organization.
External Environment of the Project #
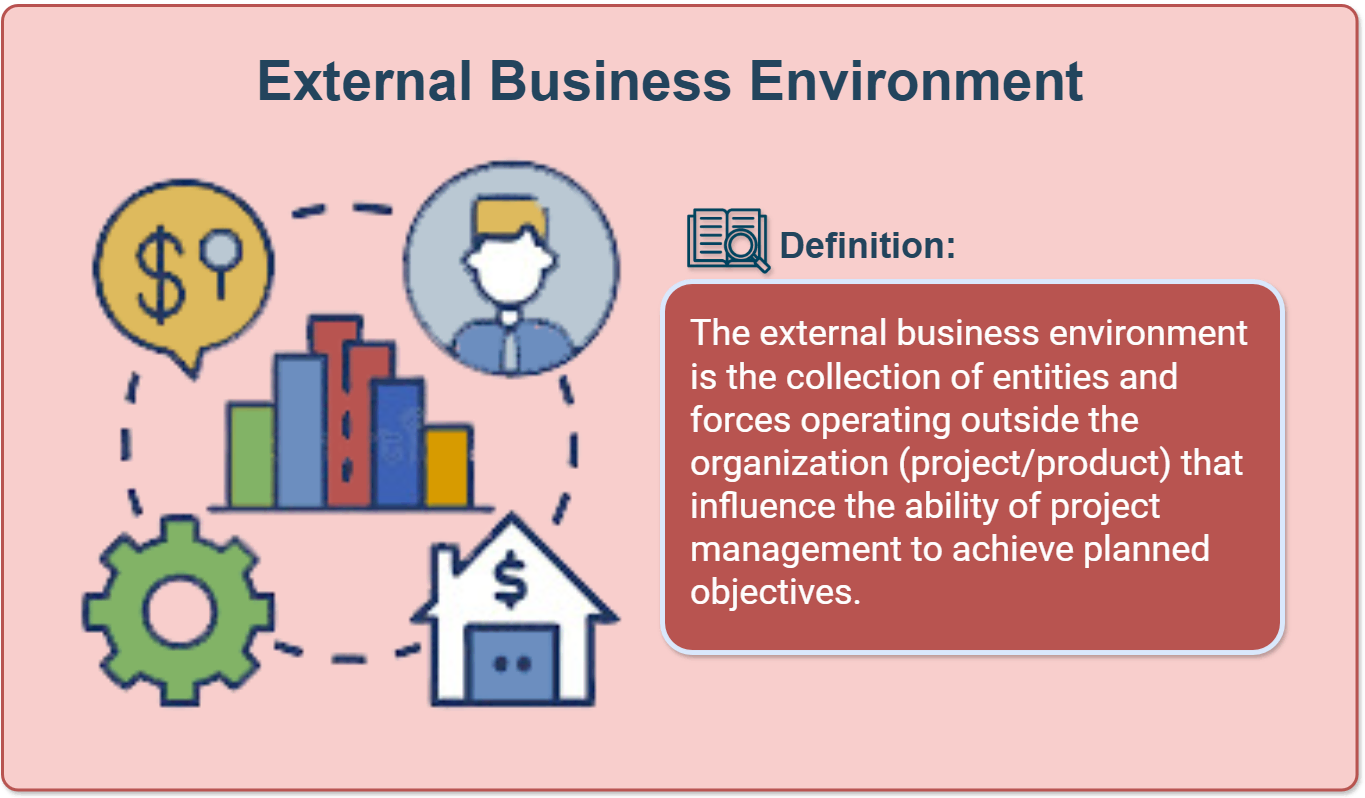
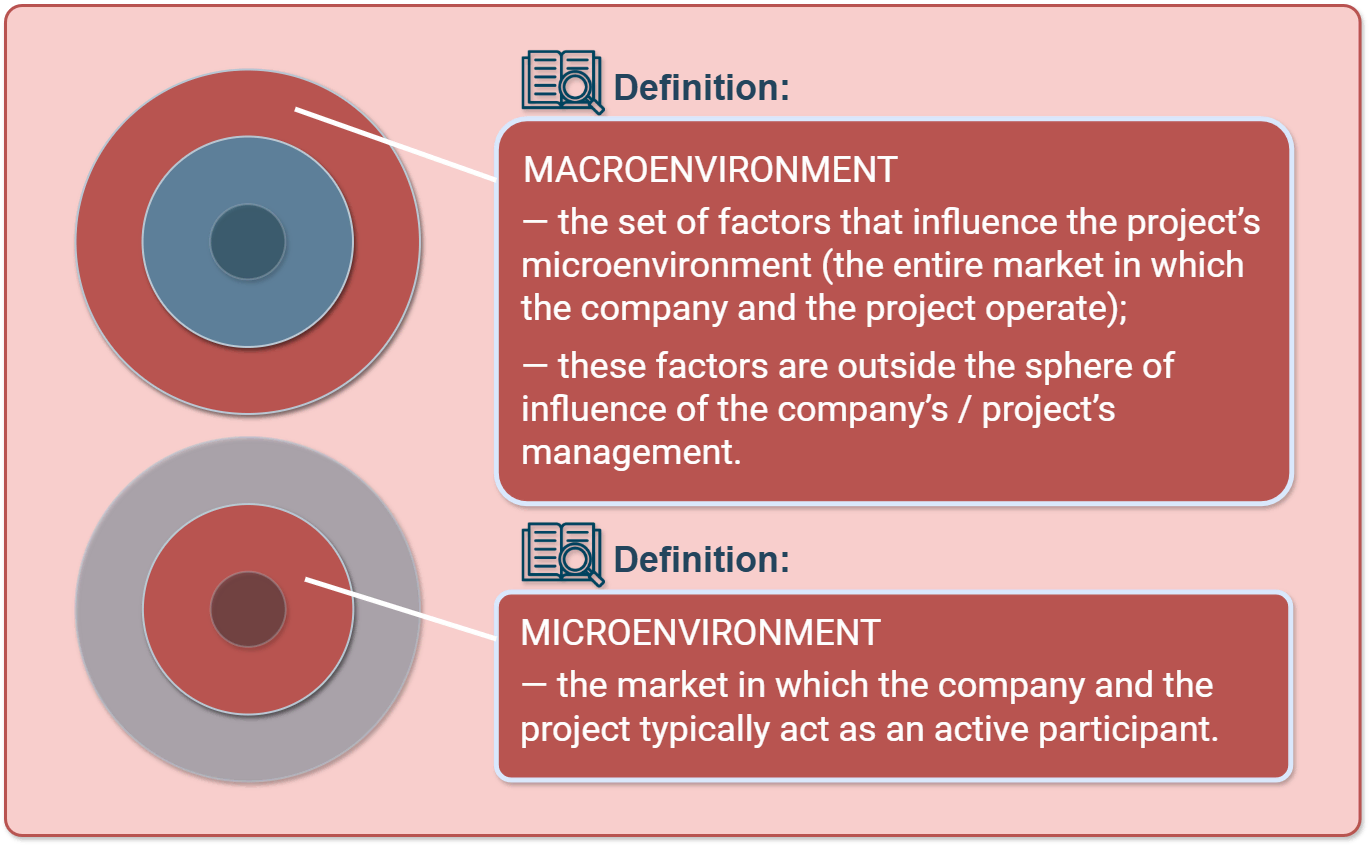
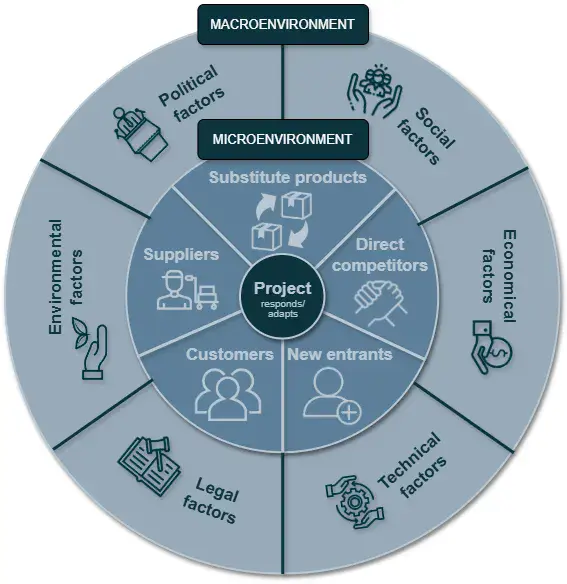
Macro factors → affect industry conditions & constraints → shape microenvironment → affect project.
Start Market Analysis from the Outer Circle:
Any market analysis begins with the macroenvironment — the outer circle of external factors that influence all industry players simultaneously.
This is a fundamental step: it forms the context in which the company, the project, and the competitors will operate.
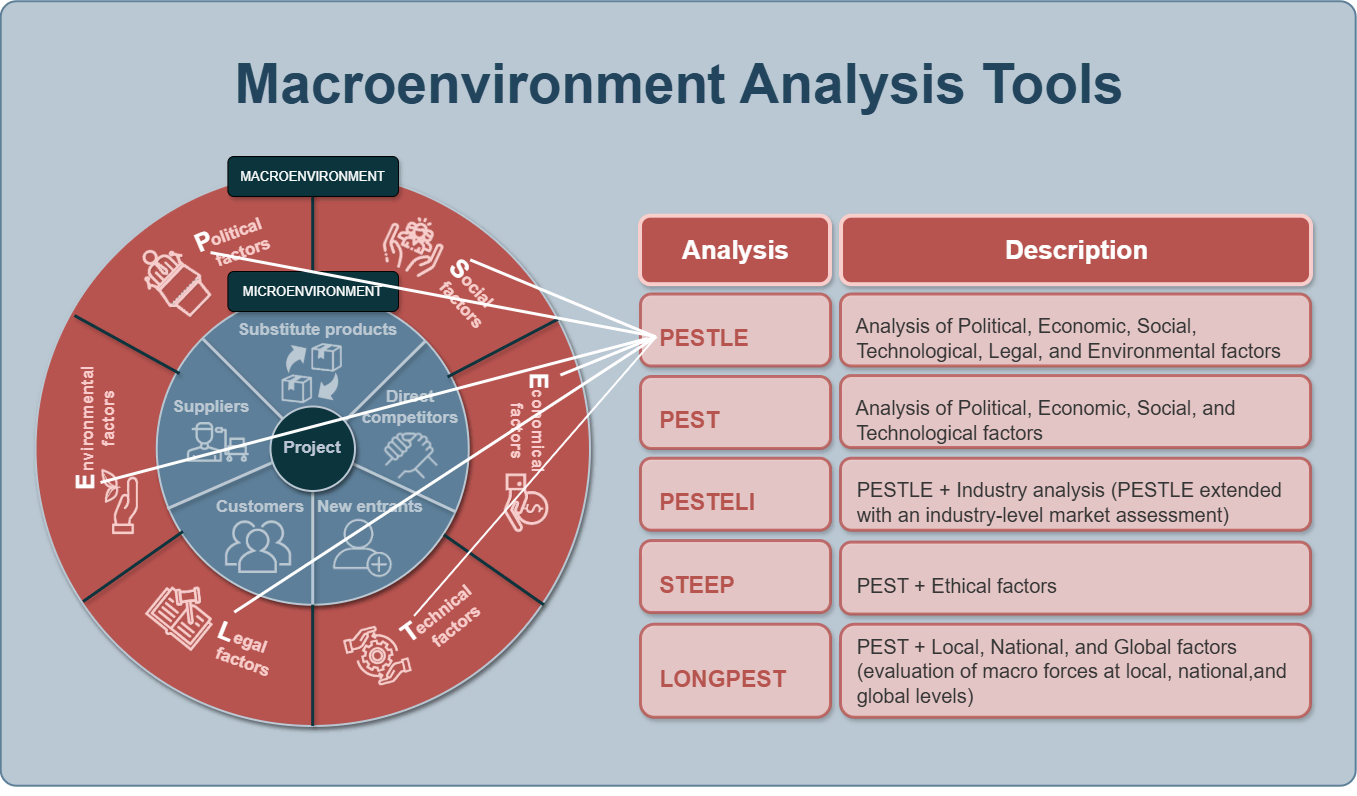
If we imagine the market as a system of concentric circles, then:
-
the outer circle contains uncontrollable forces (politics, economics, technology, society, ecology, and law);
-
the inner circle contains the market players (customers, suppliers, competitors, new entrants, substitutes);
-
at the center is the project, which responds to all these signals.
Macro-factor analysis helps not only to understand the current situation but also to predict likely changes in the environment and prepare for them in advance.
Purpose of the Analysis
No project exists in a vacuum — it develops under the influence of the external environment. To predict how the market will evolve, it is necessary to analyze macro factors step by step, transforming observations into scenarios.
- PESTEL factors (context) → Trend statements (interpreted change) → Drivers (systemic leverage points from Cross-Impact) → Scenarios.
- Factors ≠ Trends ≠ Drivers
PESTEL factors (context) → Trend statements (interpreted change) → Drivers (systemic leverage points from Cross-Impact) → Scenarios.
Factors ≠ Trends ≠ Drivers
General Logic of the “Pipeline”:
-

PESTEL Analysis
document concrete factors + validate them with data and sources + make an initial assessment of trend/impact/confidence.
-

Scenario Trend Scan
transform factors into defined trends with time horizons and signals, normalize probability and impact using agreed scales.
-

Cross-Impact Assessment
for the top trends, record directional influences on one another (who affects whom and to what extent), calculate driver score and vulnerability score, and identify key drivers and weak points.
-
Sensitivity Mapping
build scenarios from the identified drivers (configurations of trends), calculate probability, impact on the project, and priority (risk/opportunity score) for each scenario, resulting in a ranked scenario list and sensitivity maps.
Tools and Methods of Analysis #
PESTEL Analysis #
PESTEL Analysis — the foundational framework for assessing the external environment.
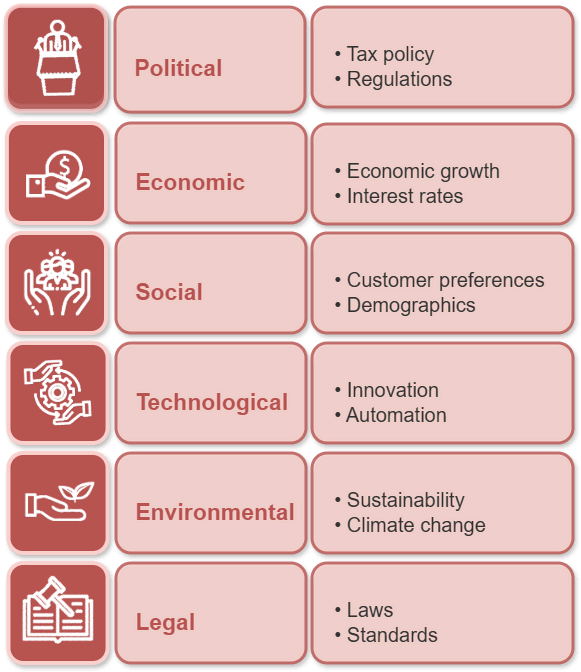
PESTEL is a systematic approach to structuring the factors that influence a project:
-

Political
political and legal decisions, stability, tax policy, government programs.
-

Economic
macroeconomics: inflation, exchange rates, income levels, investment climate.
-

Social
demographics, cultural values, lifestyle, consumer behavior.
-

Technological
innovation, speed of technology adoption, R&D, automation.
-
Environmental
ecology, climate, sustainability, emissions regulation.
-

Legal
laws, licensing, standards, consumer and data protection.
The first visual block — “PESTEL Analytical Table” and “PESTEL Summary Dashboard” — shows which specific factors are relevant for the U.S. banking industry:
-
Political
stricter regulation and Basel III oversight
-
Economic
increase of the Federal Reserve interest rate
-
Social
AI adoption in AML
-
Technological
declining trust in banks among younger audiences
-
Environmental
focus on ESG
-
Legal
tightening of KYC/AML requirements
The table below displays metrics, trend direction, and commentary for each factor.
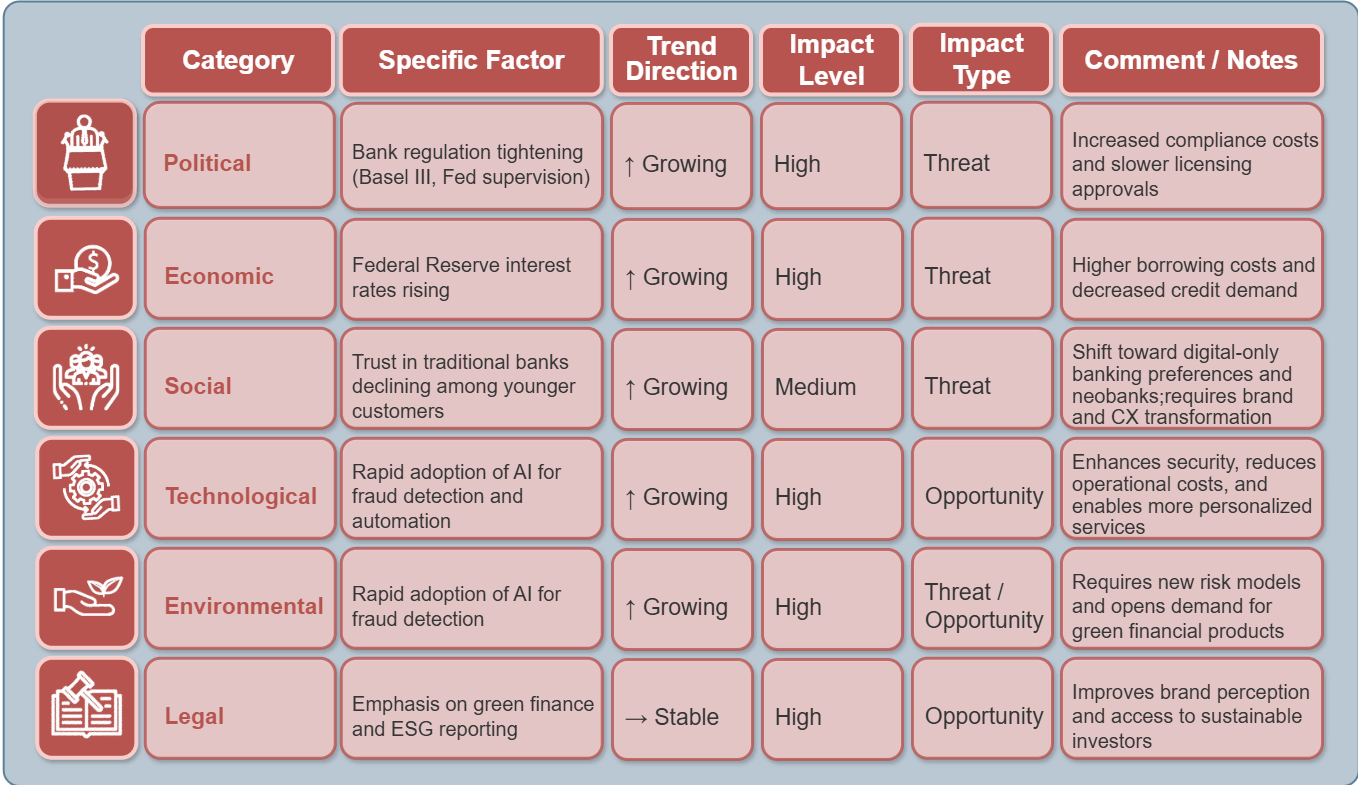
This is a real table demonstrating how external factors are distributed across the six PESTEL categories. The sample case, “launching a bank in the USA,” reflects actual data on regulation, interest rates, ESG, and AI.
The card-style dashboard below visualizes these categories as “zones of external pressure.”
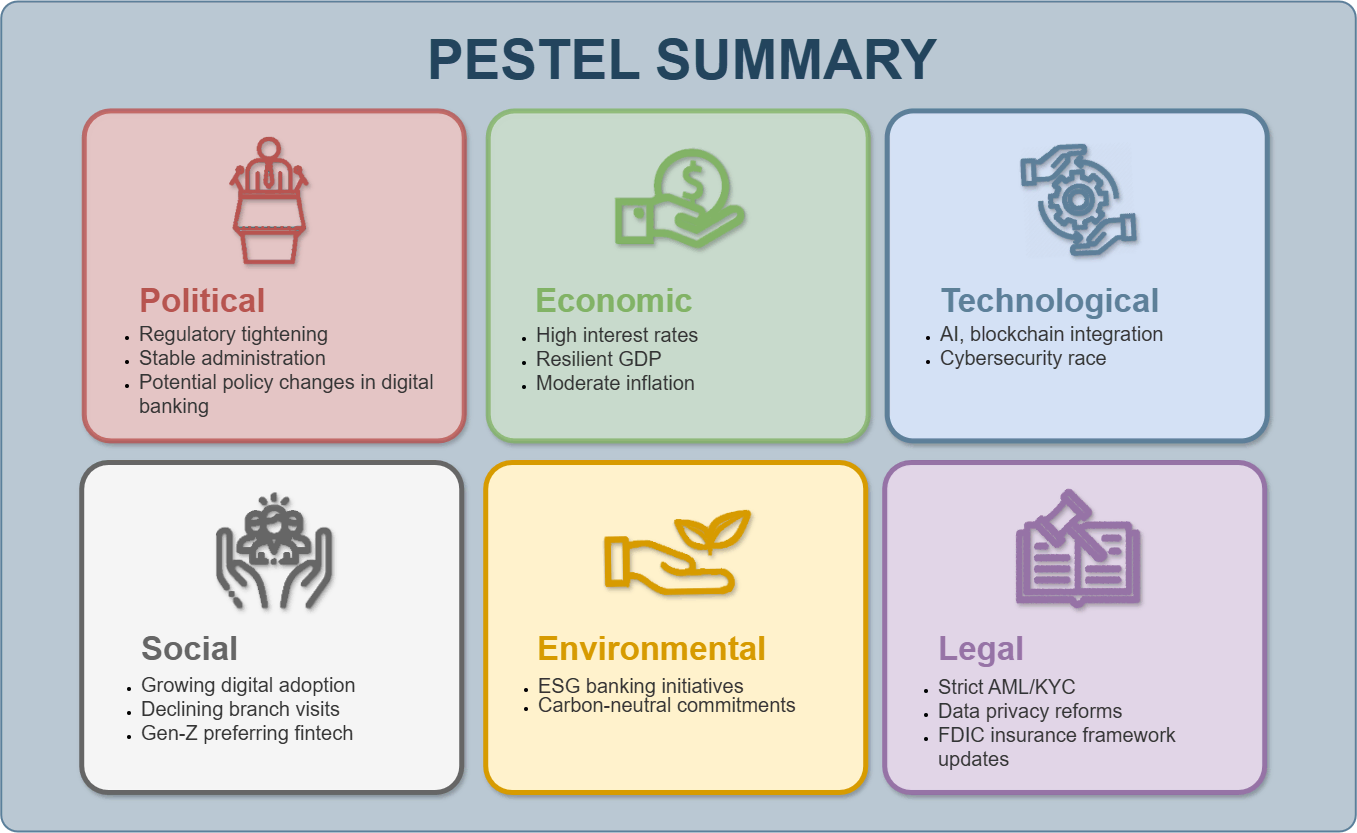
The dashboard summarizes the results of the PESTEL analysis in the form of cards with key insights.
This allows you to quickly identify where the highest pressure on the industry is located (for example, in the Legal and Technological sectors).
Detailed Breakdown of the Method Using the Case “Opening a Bank in the USA”
Step 1. Forming Factor Hypotheses (Draft List)
At this stage, specific phenomena that influence the market are identified.
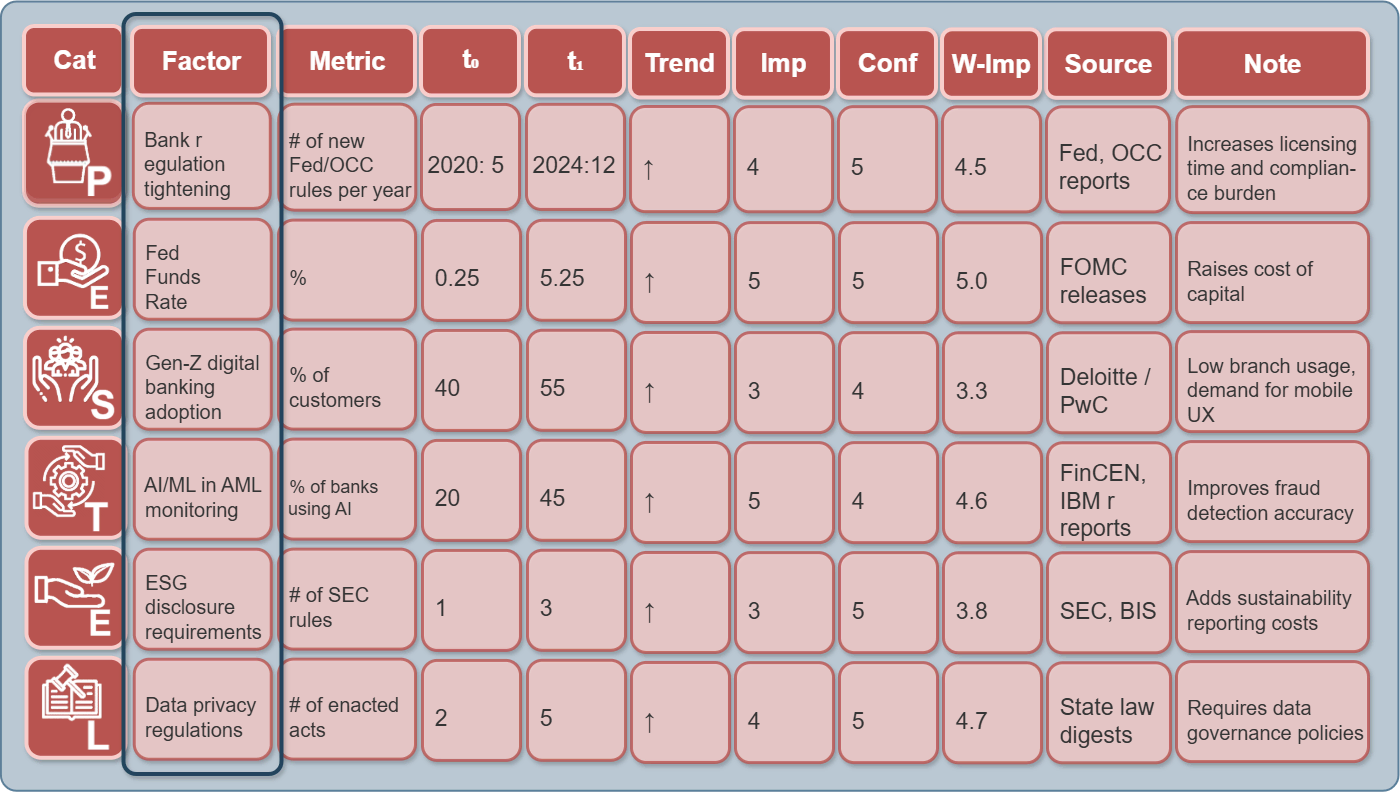
For the project “Opening a Bank in the USA”, this may include:
-
Political
Basel III Endgame, federal regulatory shifts, government oversight trends.
-
Economic
Federal Reserve rate hikes, inflation, rising unemployment.
-
Social
Customer shift toward digital-only banks, declining trust in traditional institutions.
-
Technological
AI/RegTech for fraud prevention, increasing cybersecurity requirements.
-
Environmental
ESG requirements, “green” lending.
-
Legal
Stricter AML/KYC requirements, OCC licensing procedures, compliance obligations.
Step 2. Validating Factors with Data (Research)
Each factor must be researched and backed by evidence:
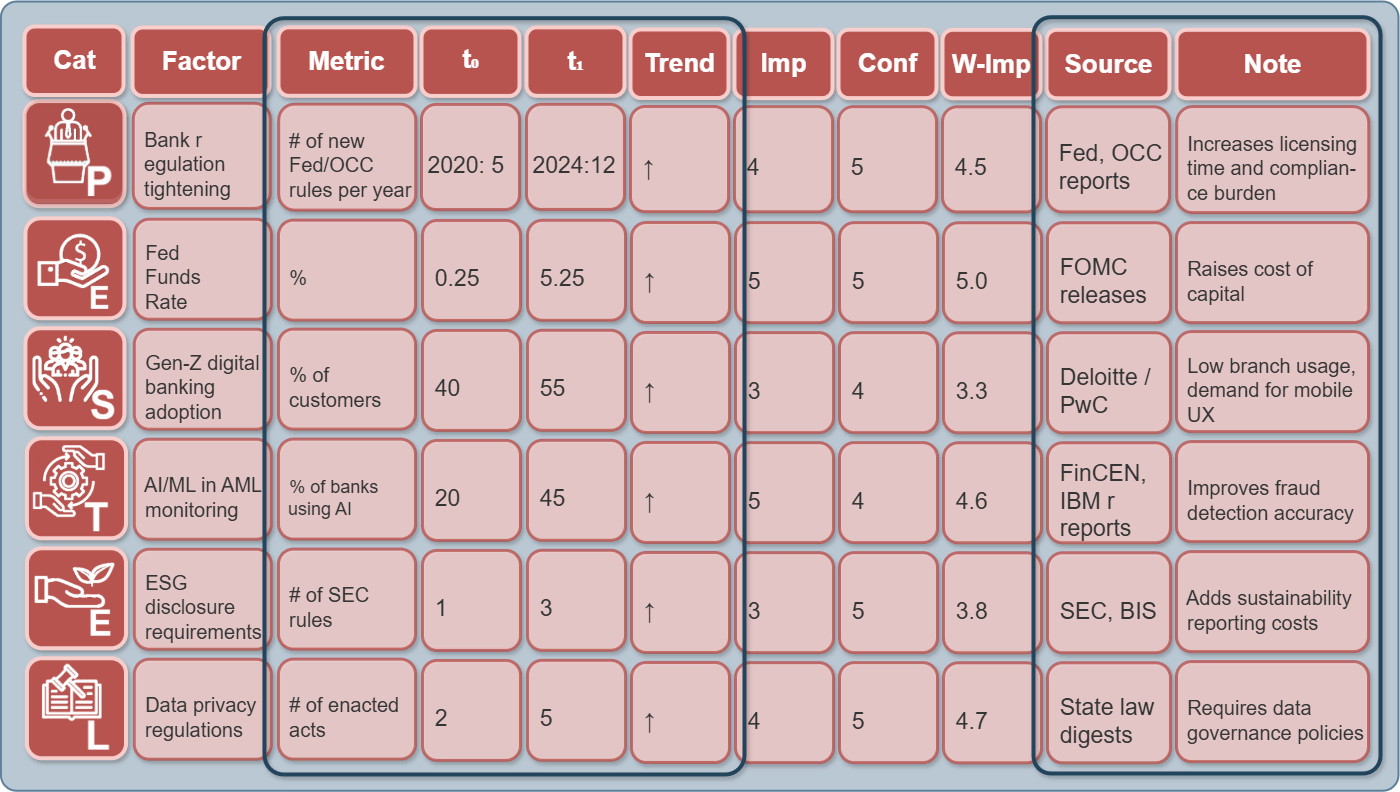
For each factor, gather:
-

Metric:
Quantifiable measure (e.g., interest rate %, fraud incidents/year).
-

Baseline (t0)
The initial reference point for the factor.
-
Current Value (t1)
The current value of the factor at the time of analysis.
-

Trend Direction:
↑ Increasing / ↓ Decreasing / → Stable.
-

Data Source:
Official reports (Fed, FinCEN, BIS, IMF, etc.)
-
Comment:
Interpretation for the project.
Step 3. Normalizing the Evaluations
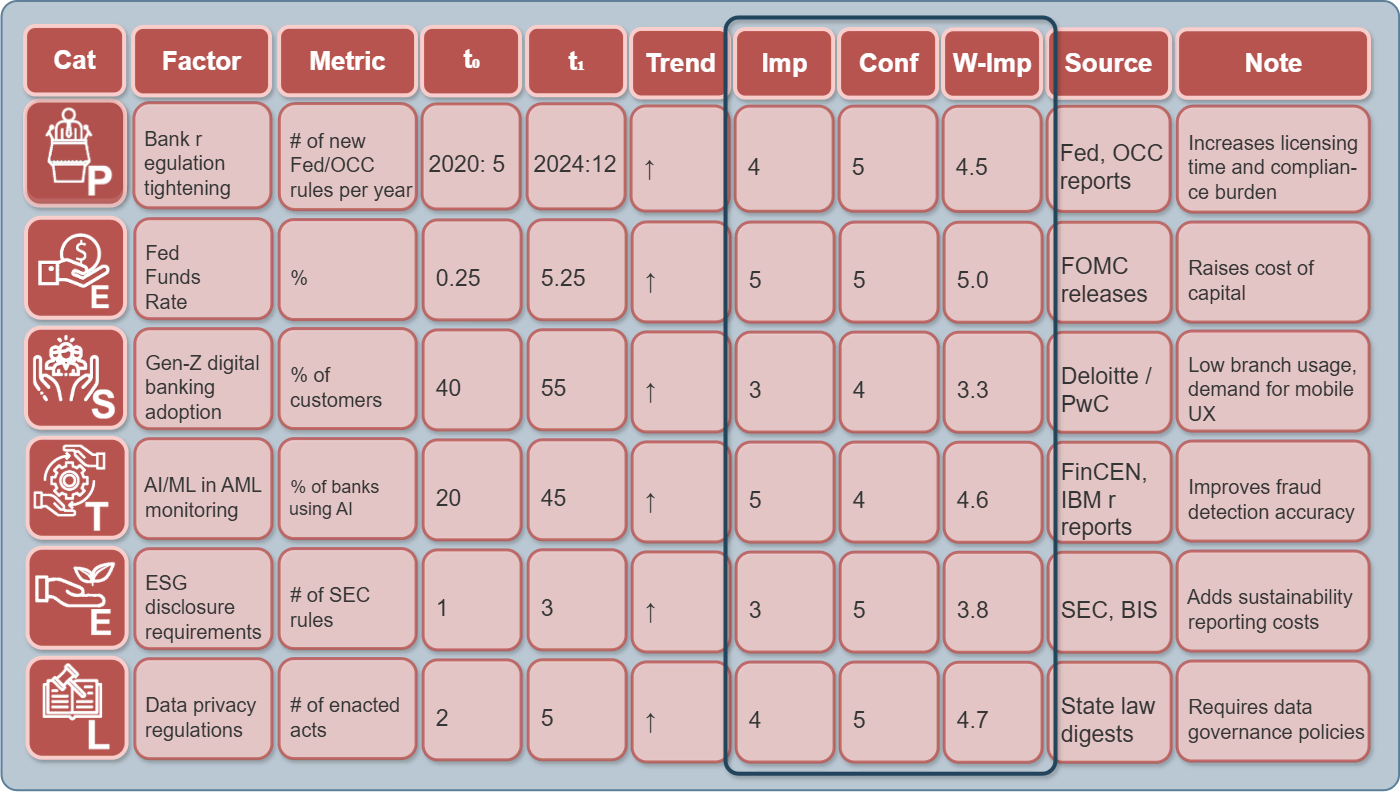
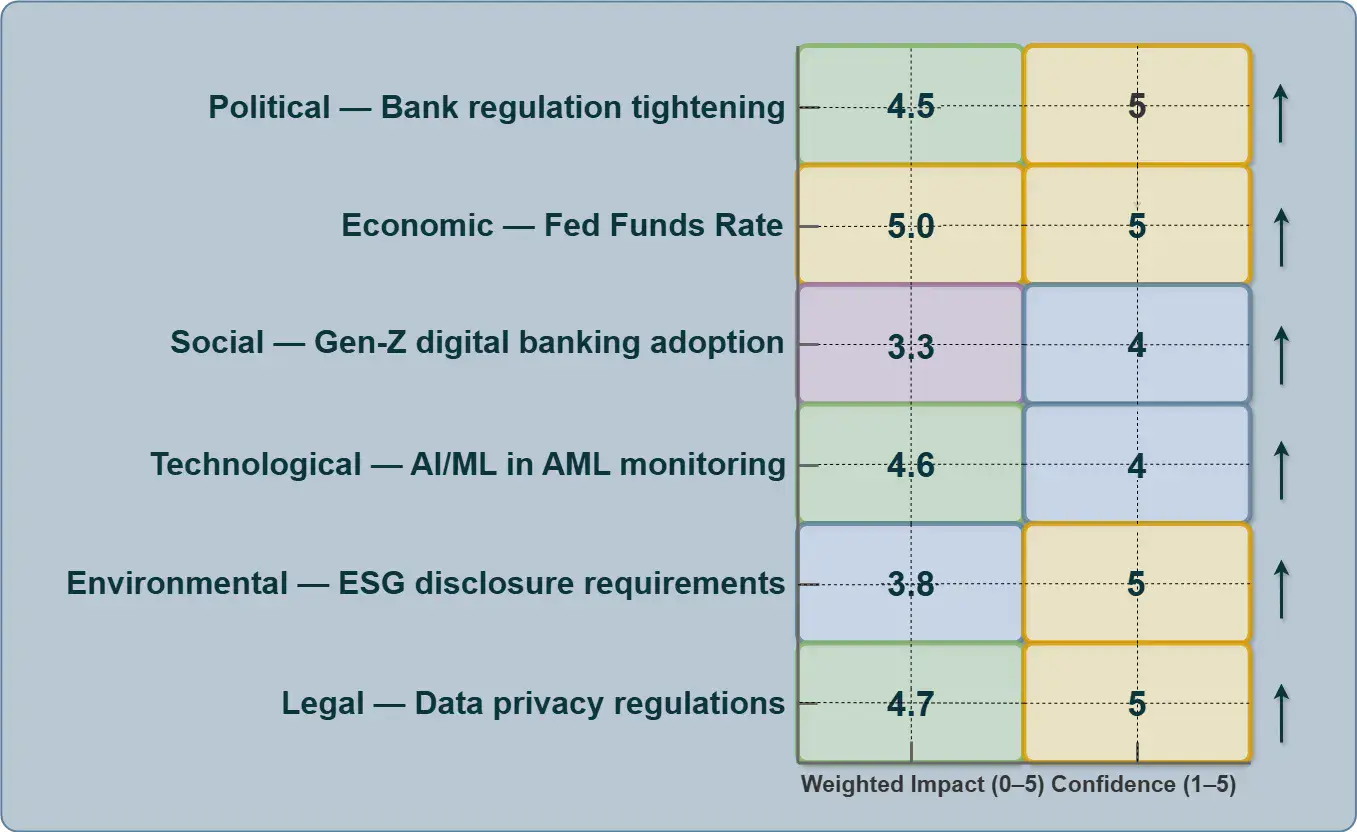
Use a numeric scale:
-
Impact:
A numerical score showing how strongly the factor influences the project or market.
-

Confidence:
Data quality (1–5).
-
Confidence-Adjusted Impact:
A confidence-adjusted estimate of impact, reflecting both the strength of the factor and the reliability of the underlying data.
💡 Confidence-Adjusted Impact (CAI)
= Impact × (0.6 + 0.1 × Confidence)
PESTEL Weighted-Impact Heatmap
(Data from Macro Factors Template)
Scenario Trend Scan (STEEP / DESTEP) #
A scenario is a possible state of the future driven by key impact factors’ trajectory
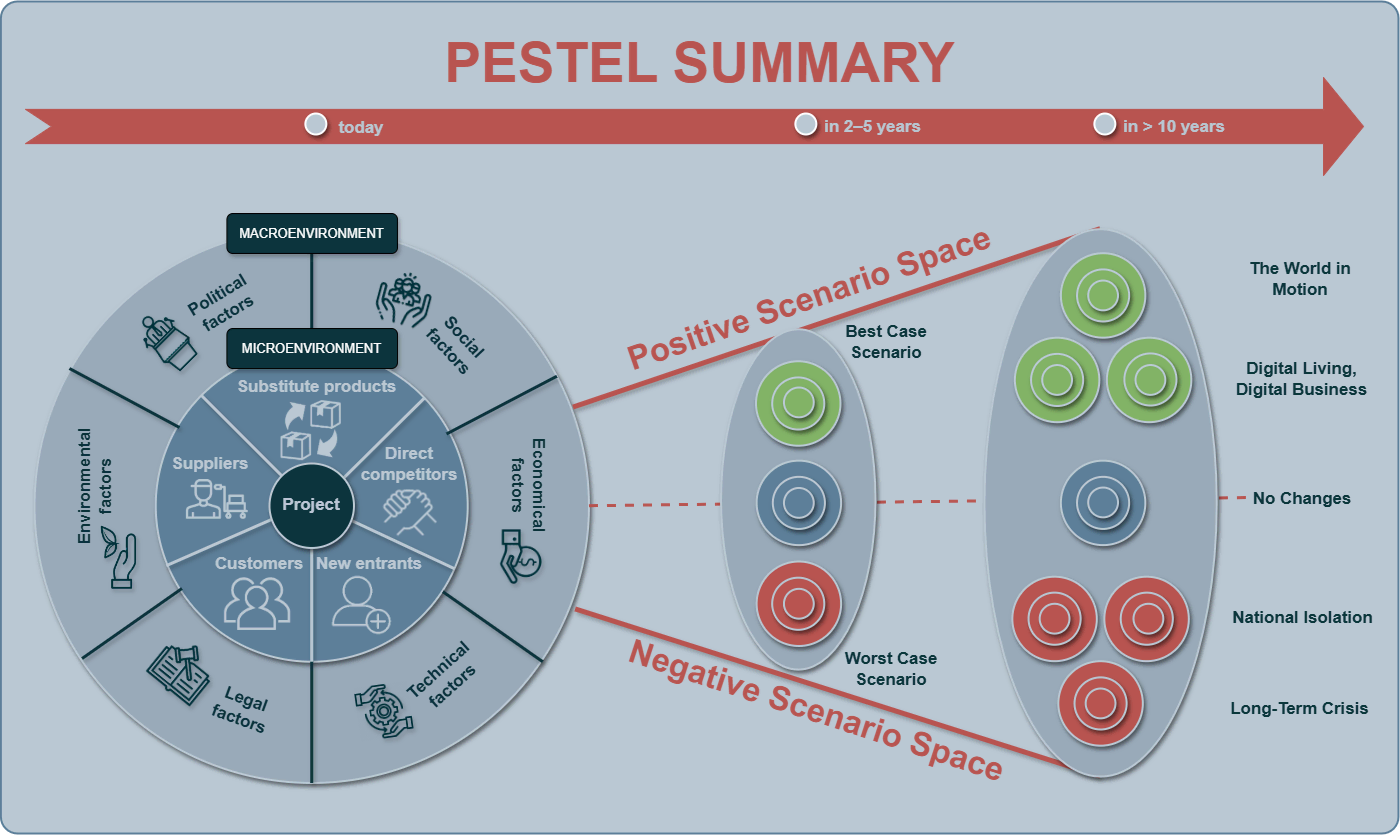
This method is used to identify long-term trends and weak signals that have not yet become obvious but may significantly reshape the market.
It applies extended categories (such as Demographic or Ethical) and operates across long time horizons.
Methodology
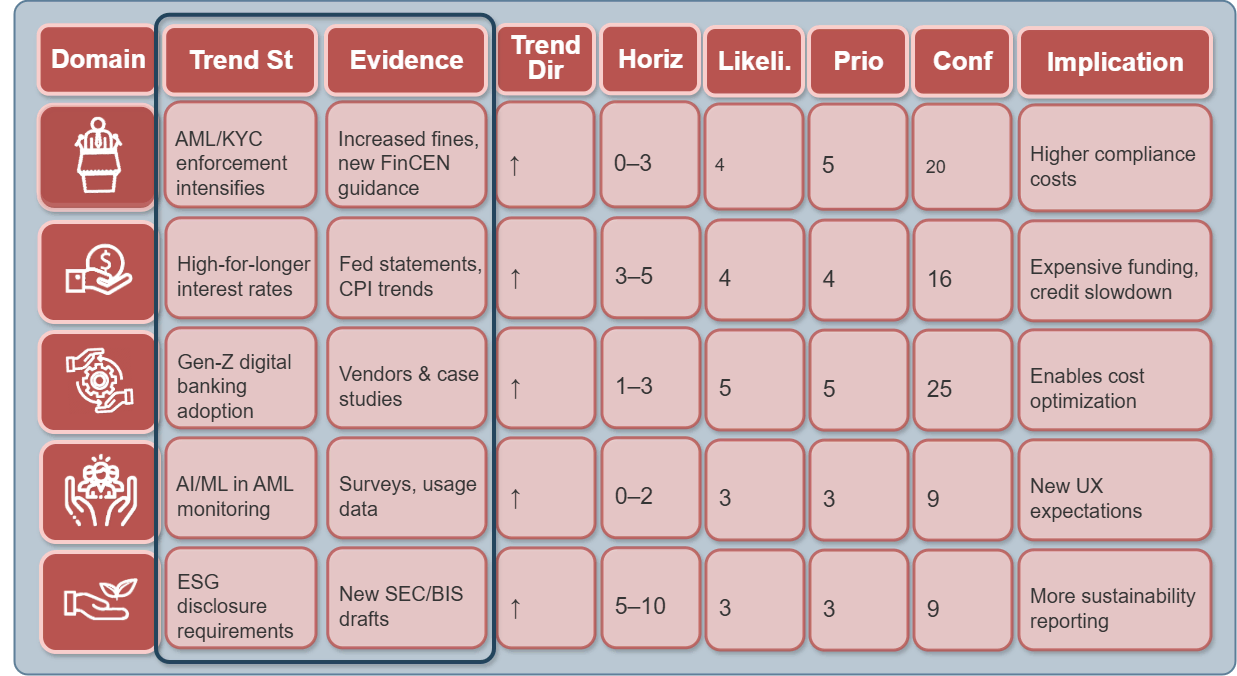
Step 1. Select Key Factors from PESTEL.
From the list of factors, select those that have high impact and a growing trend.
1. Define the time horizon (5–10 years).
2. Collect data for each dimension (social, technological, economic, etc.).
3. Identify early signals — weak indicators of emerging trends.
4. Build a trend map and assess each trend’s direction (growing, declining, uncertain).
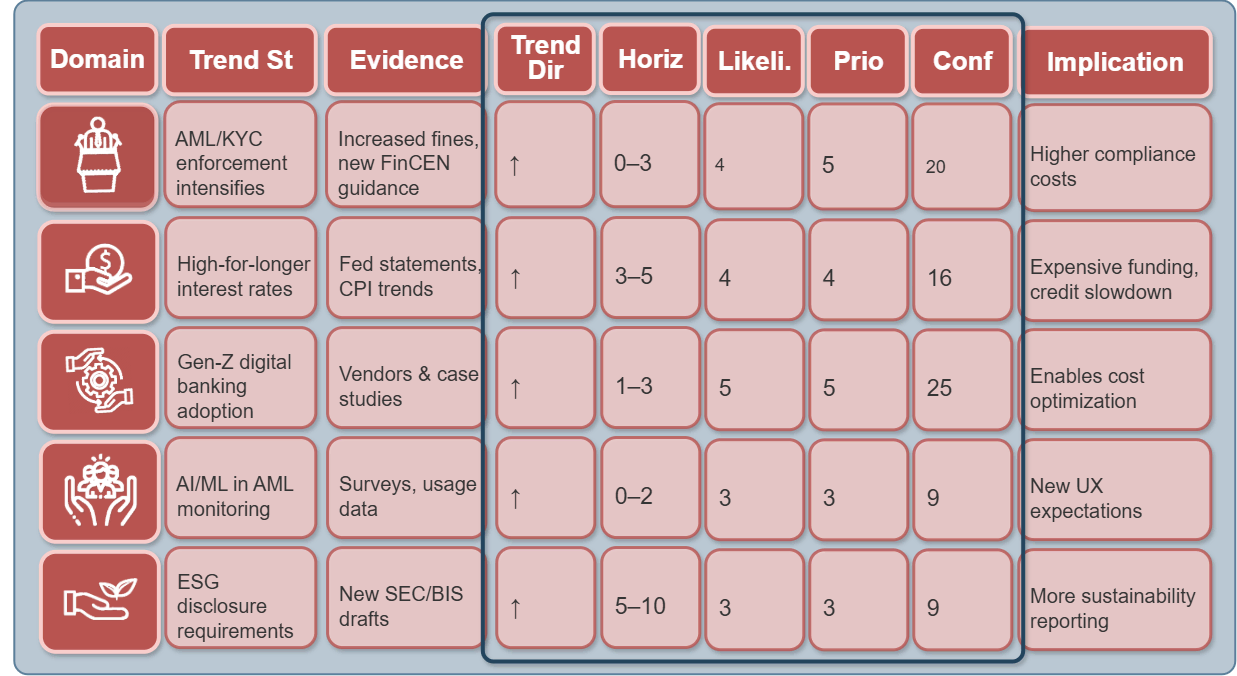
Step 2. For Each Eactor, Document:
-
Trajectory:
↑ growing / ↓ declining / ↔ stable / ± volatile.
-
Time Horizon:
0–2 / 3–5 / 5–10 years.
-
Likelihood (1–5):
probability of continuation.
-
Impact (1–5):
effect on project KPIs.
-
Priority =
Monitoring & sequencing metric.
Visualizations
Trend Cards Grid
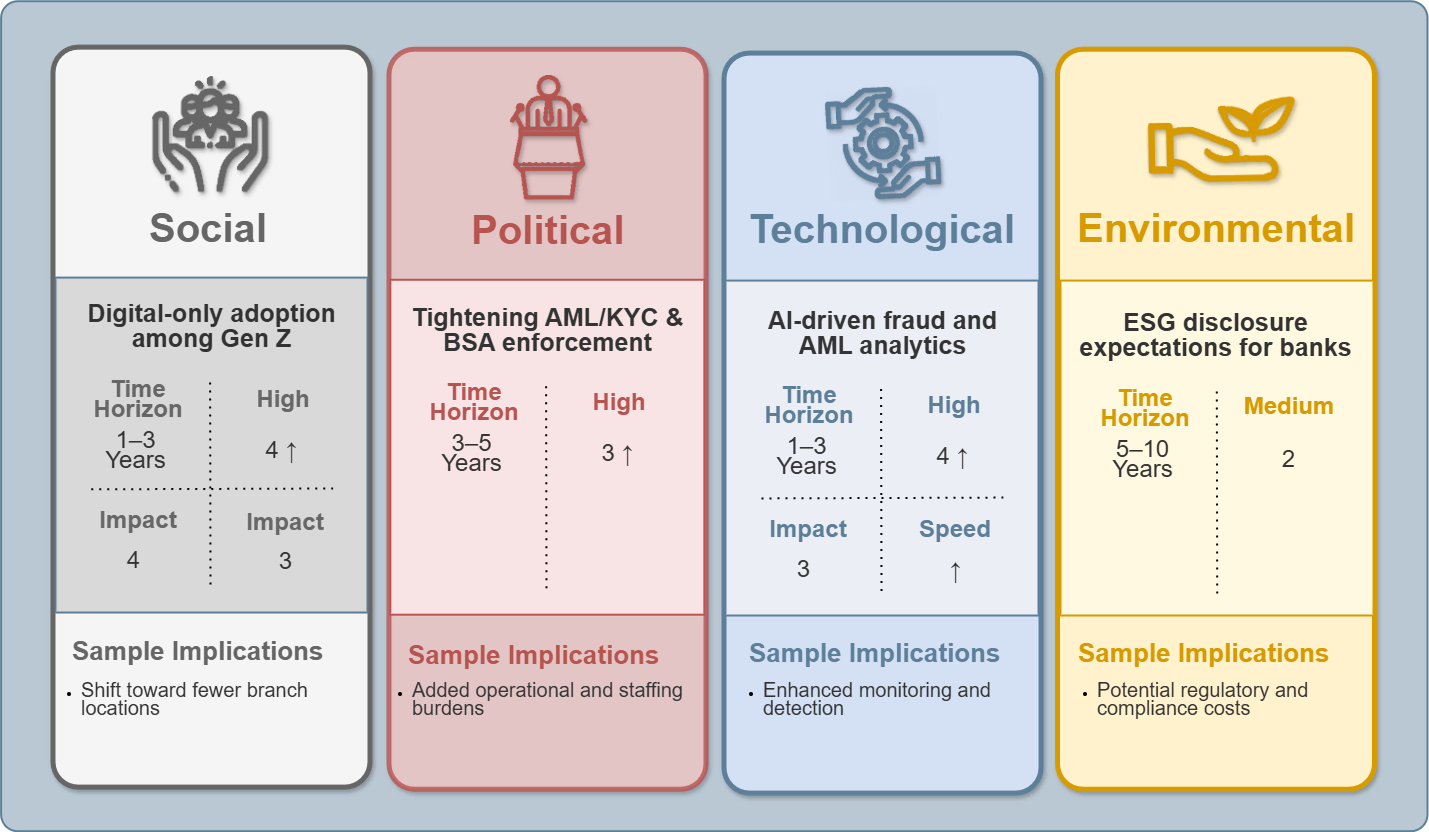
Cards with icons and color coding indicating probability and time horizon. Each card provides a concise description of a trend. They show which trends will have an impact in the next 1–3 years and which ones will influence the market in the long term.
Scenario Trend Matrix (Cross-Analysis of STEEP Trends)
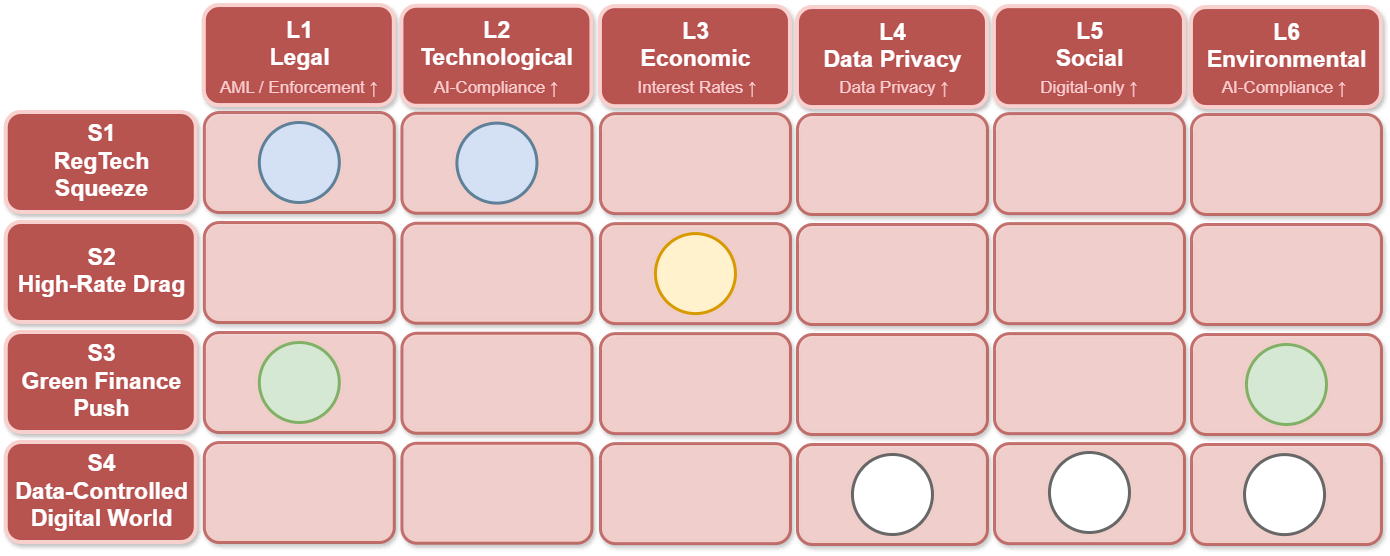
The table presents a cross-analysis of six macro trends (STEEP factors) across four market development scenarios:
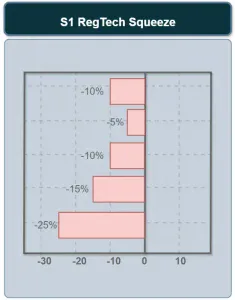
- S1 — RegTech Squeeze
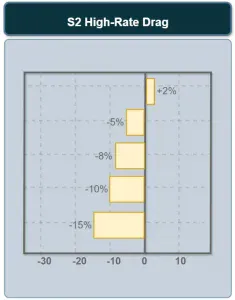
- S2 — High-Rate Drag
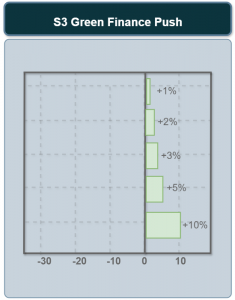
- S3 — Green Finance Push
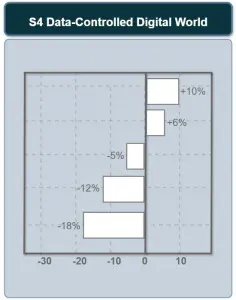
- S4 — Data-Controlled Digital World
Rows represent the scenarios, columns represent the key macro-trend domains, circles indicate the degree and nature of each trend’s impact on a scenario.
Trend Domains (Macro Trends):
-

Legal — AML / Enforcement ↑
Intensification of regulatory and enforcement pressure (AML/KYC, BSA).
-

Technological — AI-Compliance ↑
Growing role of AI and automation in compliance and RegTech.
-

Economic — Interest Rates ↑
Prolonged high interest rate environment.
-

Data Privacy — Data Privacy ↑
Stronger data control, privacy regulation, and data governance requirements.
-

Social — Digital-only ↑
Shift of customers toward digital-only banking and changing consumer behavior.
-

Environmental — ESG ↑
ESG requirements, sustainable finance, “green” products, and disclosure.
Colors and Indicators:
The color and size of each circle represent the type and strength of a trend’s impact on a scenario:

Blue — strong structural impact
(the scenario is critically dependent on this trend)

Yellow — moderate / indirect impact
(economic conditions or delayed response effects)

Green — opportunity and growth
(positive strategic direction)

White — background or systemic factor
(not a primary driver, but shapes the operating environment)
Interpretation for the “Opening a Bank in the U.S.” Case:
- S1 RegTech Squeeze → requires a strong RegTech architecture and advanced KYC/AML automation.
- S2 High-Rate Drag → highlights risks of prolonged high interest rates constraining growth.
- S3 Green Finance Push → creates strategic opportunities in ESG banking and sustainable finance.
- S4 Data-Controlled Digital World → emphasizes the critical importance of data governance, privacy-by-design, and compliance-first digital products.
Source Evidence Panel (Data Provenance & Confidence Levels)
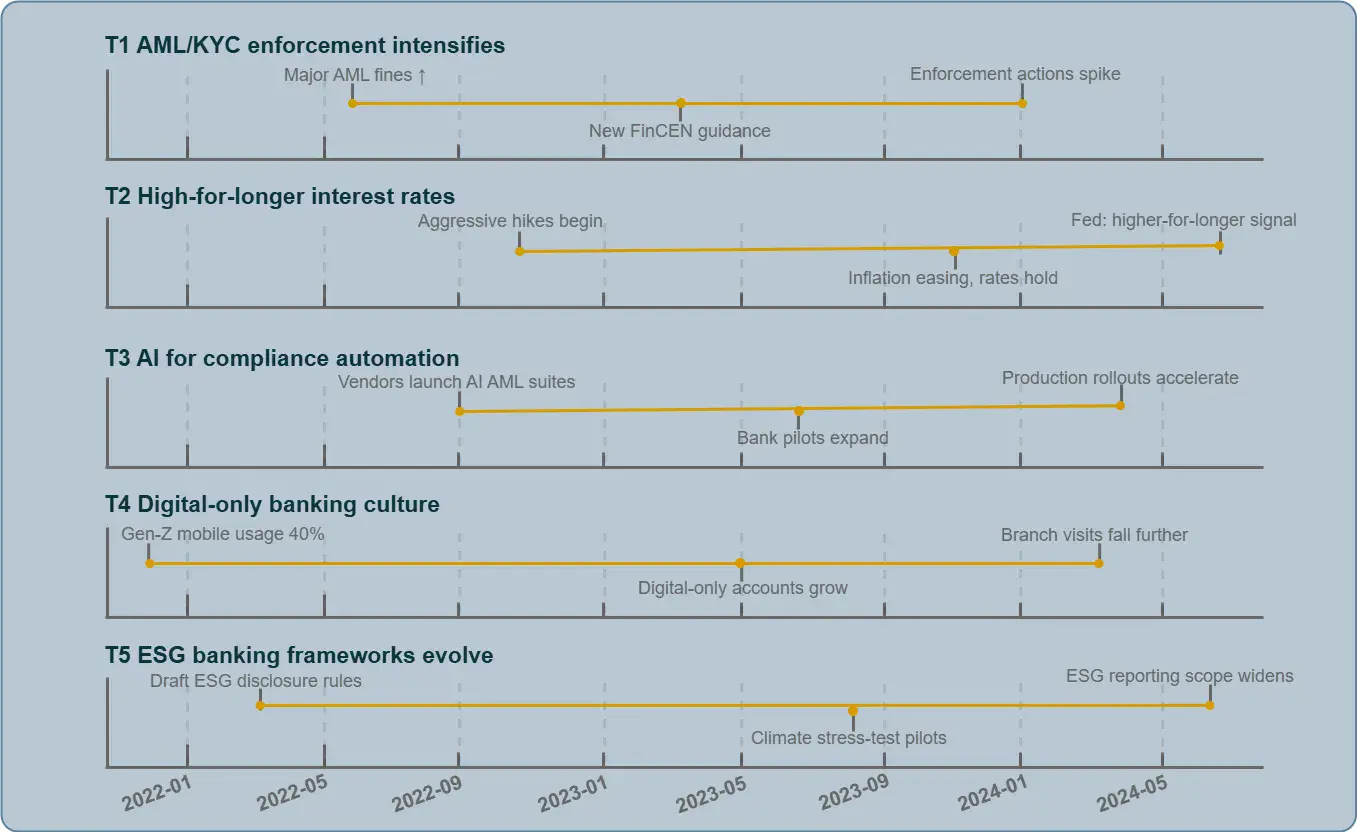
Signals Timeline — Evidence per Trend
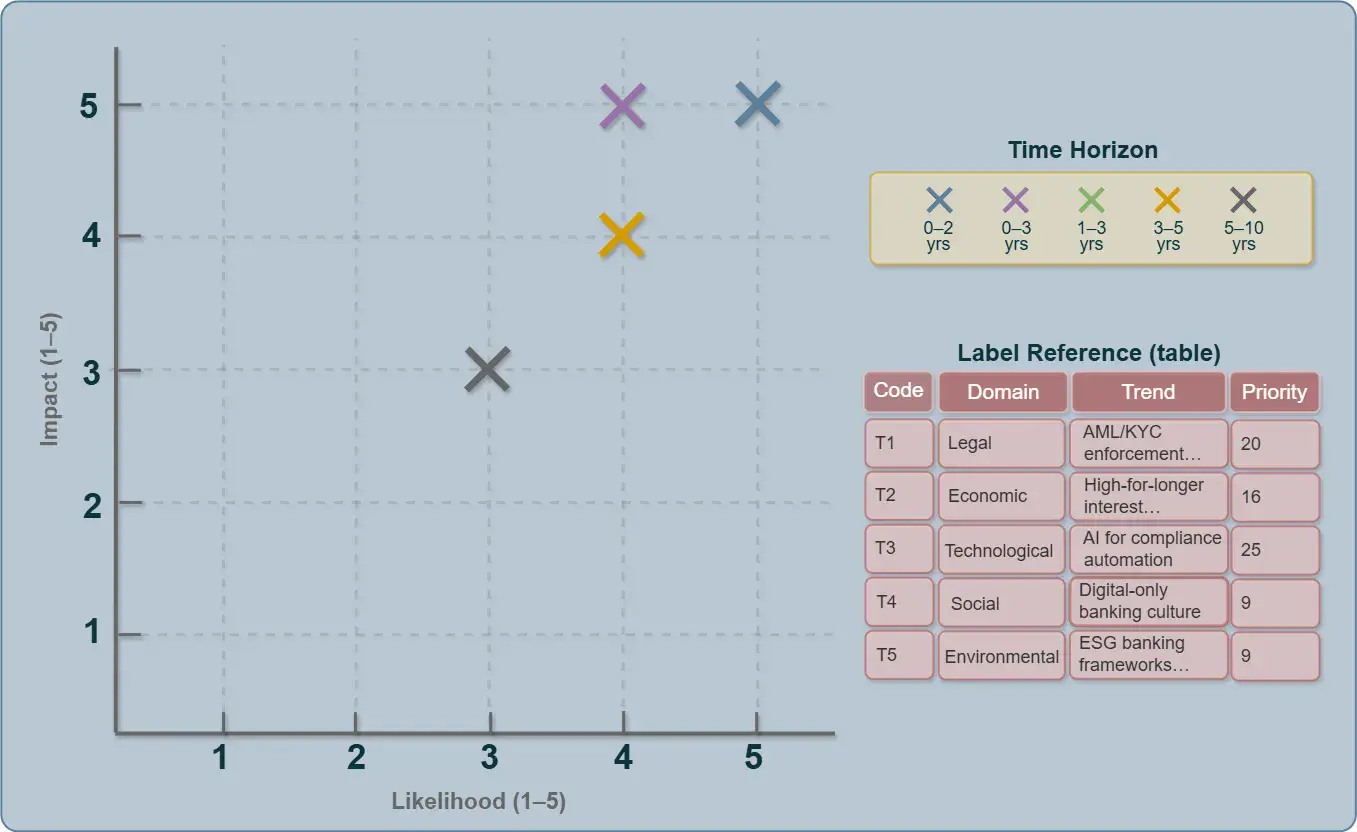
Trend Priority Bubble Chart — Improved Readability
Cross-Impact Assessment #
Opening a Bank in the U.S.
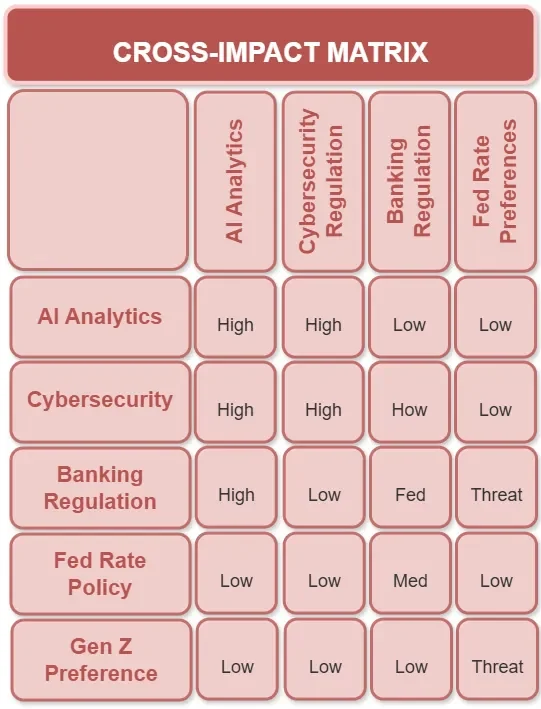
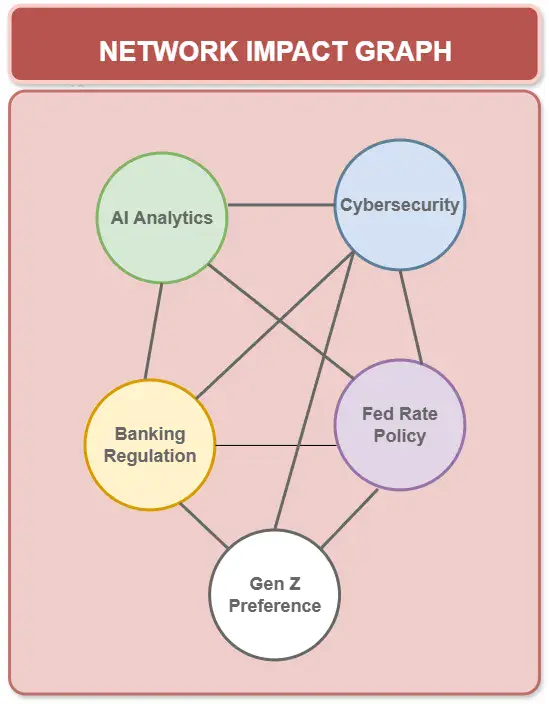
The Cross-Impact method makes it possible to:
- build an interaction matrix between factors;
- assess how one factor influences another;
- identify chain reactions (for example: “growth of digitalization → new privacy risks → tightening of legal regulation”).
Methodology
Step 1. Use Trends from the Scenario Trend Scan.
Select 6–10 factors with high impact.
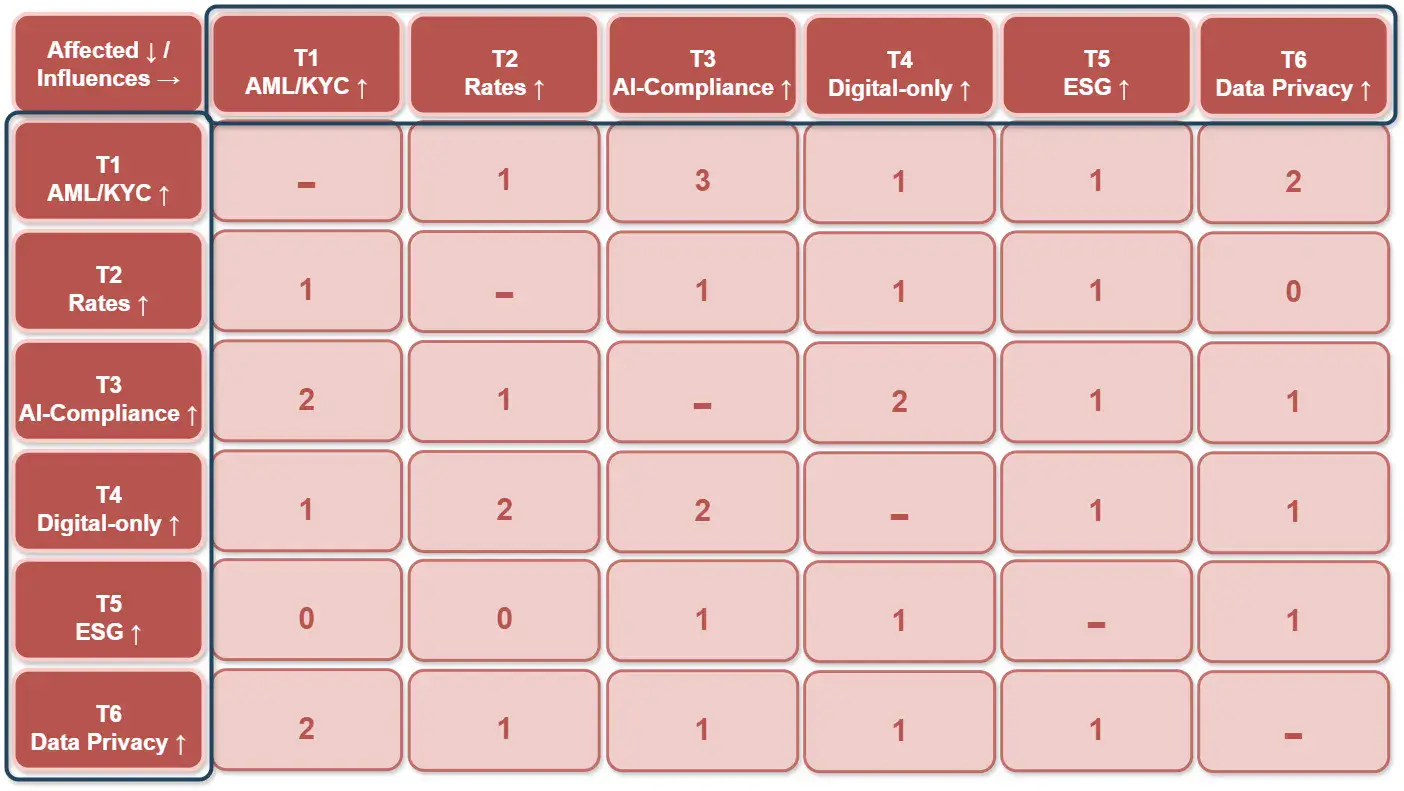
Matrix axes:
-
Columns (Influences):
“who influences” (sources of impact).
-
Rows (Affected):
“who is affected” (objects of impact).
Step 2. Build the Interaction Matrix
What exactly is evaluated: Not categories.
We evaluate specific trends identified in the previous step, for example:
- T1 — Intensifying AML/KYC enforcement
- T2 — High-for-longer Fed rates
- T3 — AI-driven AML/Fraud analytics adoption
- T4 — Digital-only banking among Gen Z
- T5 — State data-privacy expansion
- T6 — ESG disclosure requirements
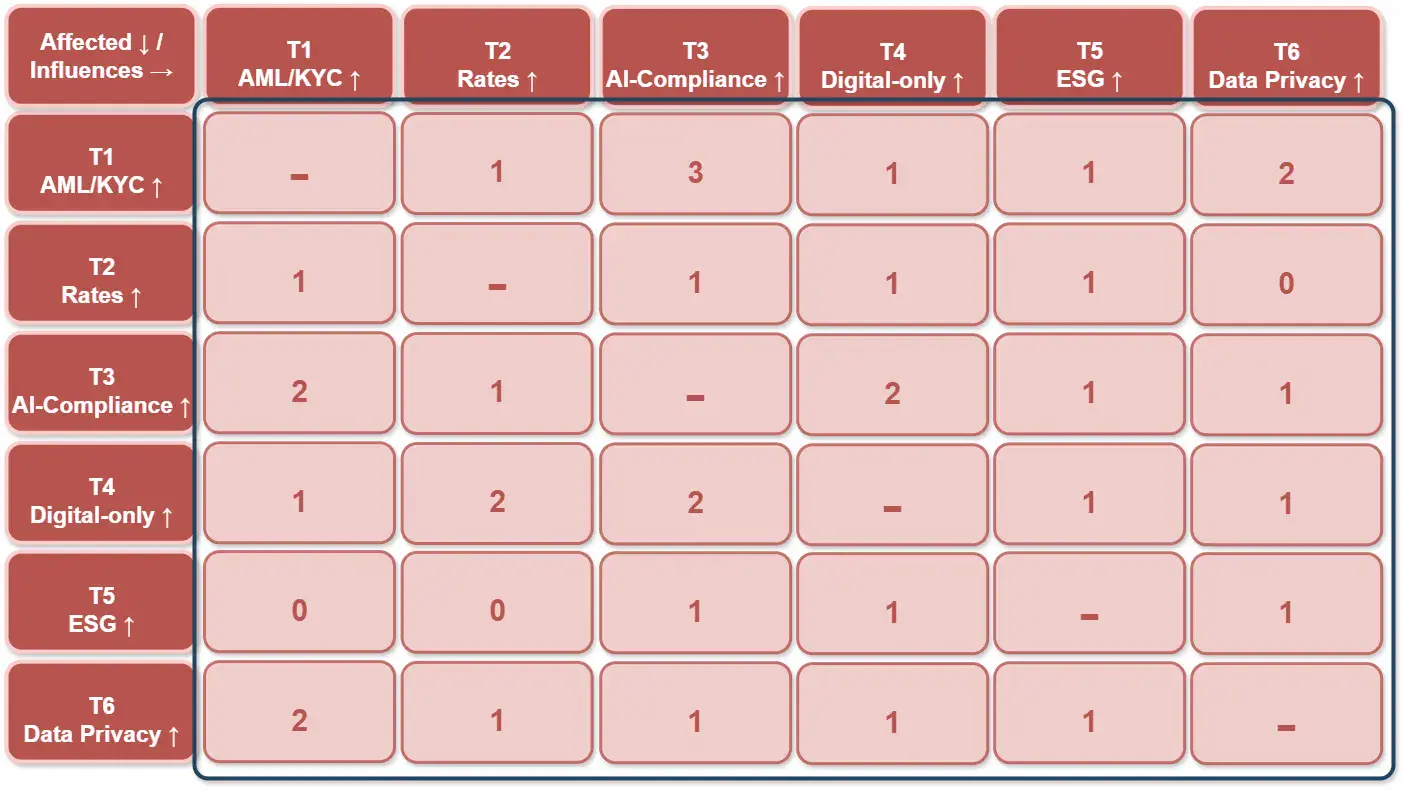
-

Cells:
impact strength (H / M / L or 3 / 2 / 1).
No single factor ever exists in isolation.
For example, technological progress can stimulate changes in legislation, while the environmental agenda can accelerate the development of green technologies.
Scale:
- 0 — no noticeable impact
- 1 (Low) — weak
- 2 (Med) — moderate
- 3 (High) — strong
(optionally, a +/− sign can be added to indicate the nature of the impact: reinforcing / restraining)
Step 3. Interpretation of Results
- Factors with multiple values of 3 (High) in rows → drivers of change (initiators).
- Factors with multiple values of 3 (High) in columns → vulnerable points (dependent elements of the system).
Derived Scores:
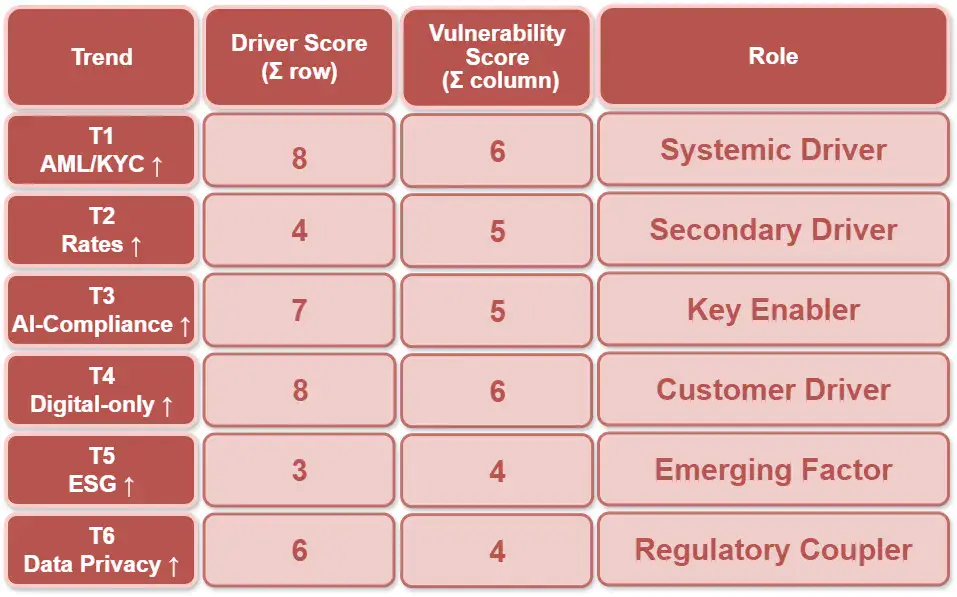
Interpretation and Metrics:
-

Driver Score (∑ across the row):
— the total impact of a trend on other factors → indicates who “drives the system.”
-

Vulnerability Score (∑ down the column):
— the total impact of other factors on a given trend → indicates who is most dependent.
-

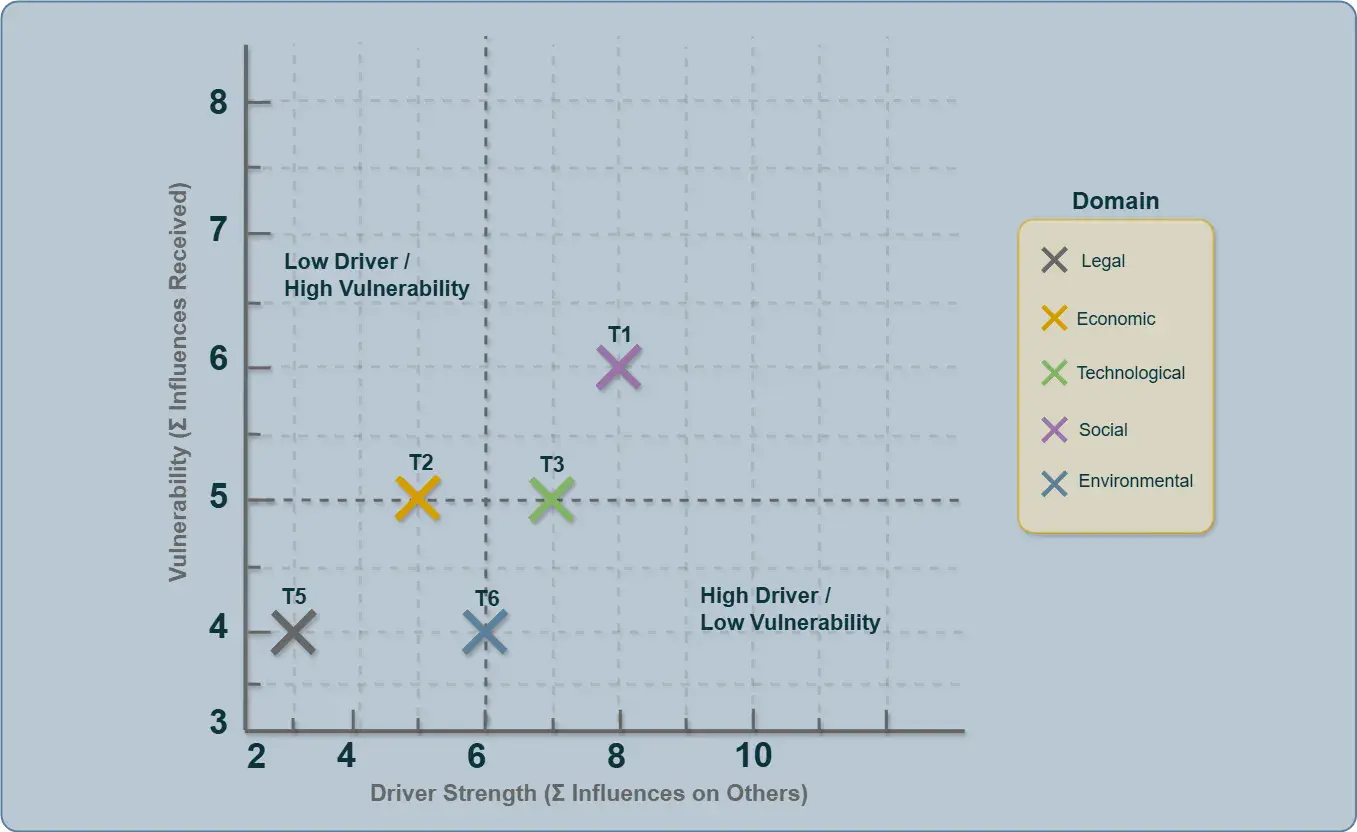
Key Drivers:
— trends with a high Driver Score and a relatively low Vulnerability Score.
-

Sensitive Nodes:
— trends with a low Driver Score and a high Vulnerability Score.
Interpretation and Metrics:
-

AML/KYC Enforcement ↑
(systemic regulatory driver)
-

AI Compliance ↑
(key technological enabler)
-

Digital-only Banking ↑
(consumer behavior driver)
-

ESG ↑
(shaping long-term requirements and standards)
-

Data Privacy ↑
(regulatory-systemic linking factor)
Cross-Impact Output → Input for Sensitivity Analysis:
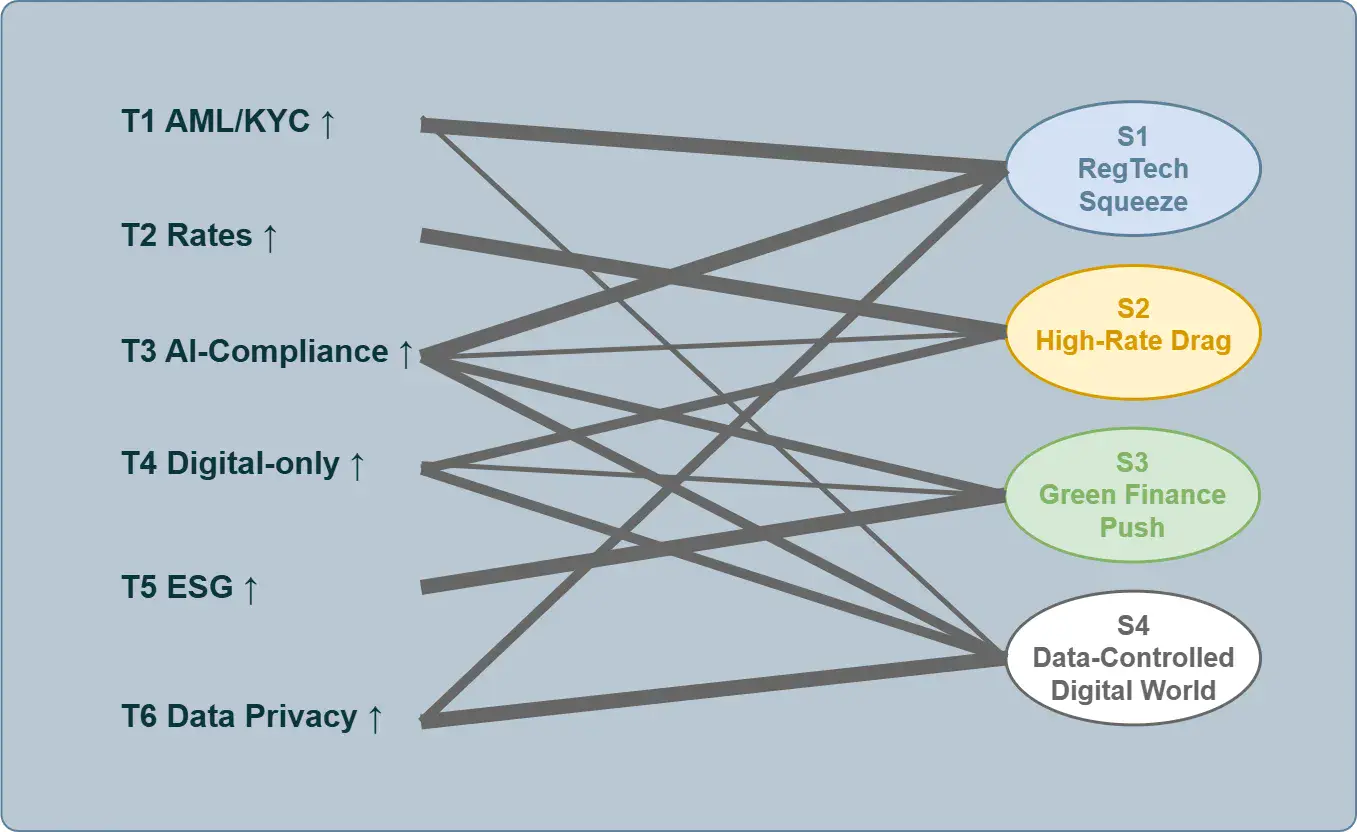
The result of the Cross-Impact analysis is a set of logically connected trend clusters that form the foundation for scenario development.
S1 — RegTech Squeeze
T1 (AML/KYC ↑) + T6 (Data Privacy ↑) + T3 (AI Compliance ↑ as a response to regulatory pressure)
S2 — High-Rate Drag
T2 (Interest Rates ↑) + T4 (Digital-only ↑ as a market adaptation response)
S3 — Green & Lean Finance
T5 (ESG ↑) + T3 (AI Compliance ↑ to reduce costs and risks)
S4 — Data-Controlled Digital World
T6 (Data Privacy ↑) + T4 (Digital-only ↑) + T3 (AI Compliance ↑ as a governance mechanism)
→ a scenario in which digital banking evolves within a strict data-regulatory framework
Types of Drivers (Roles) in the Cross-Impact Matrix:
| Role | Description |
|---|---|
| Systemic Driver | The primary source of change that initiates chain reactions (e.g., AML/KYC enforcement, data privacy regulation) |
| Secondary Driver | A factor that reinforces or supports a systemic driver (e.g., ESG requirements) |
| Key Enabler | A catalyst or implementation tool for change (e.g., AI Compliance, RegTech automation) |
| Customer Driver | A shift in customer behavior that shapes market demand (e.g., Gen Z digital-only banking) |
| Constraint | A limiting factor that creates barriers (e.g., high interest rates) |
| Lagging Trend | An outcome of changes rather than their source (reacts to an already established environment) |
Step 4. Visualize the Relationships
Influence Network Graph (Directed, Weighted): Based on Cross-Impact Assessment
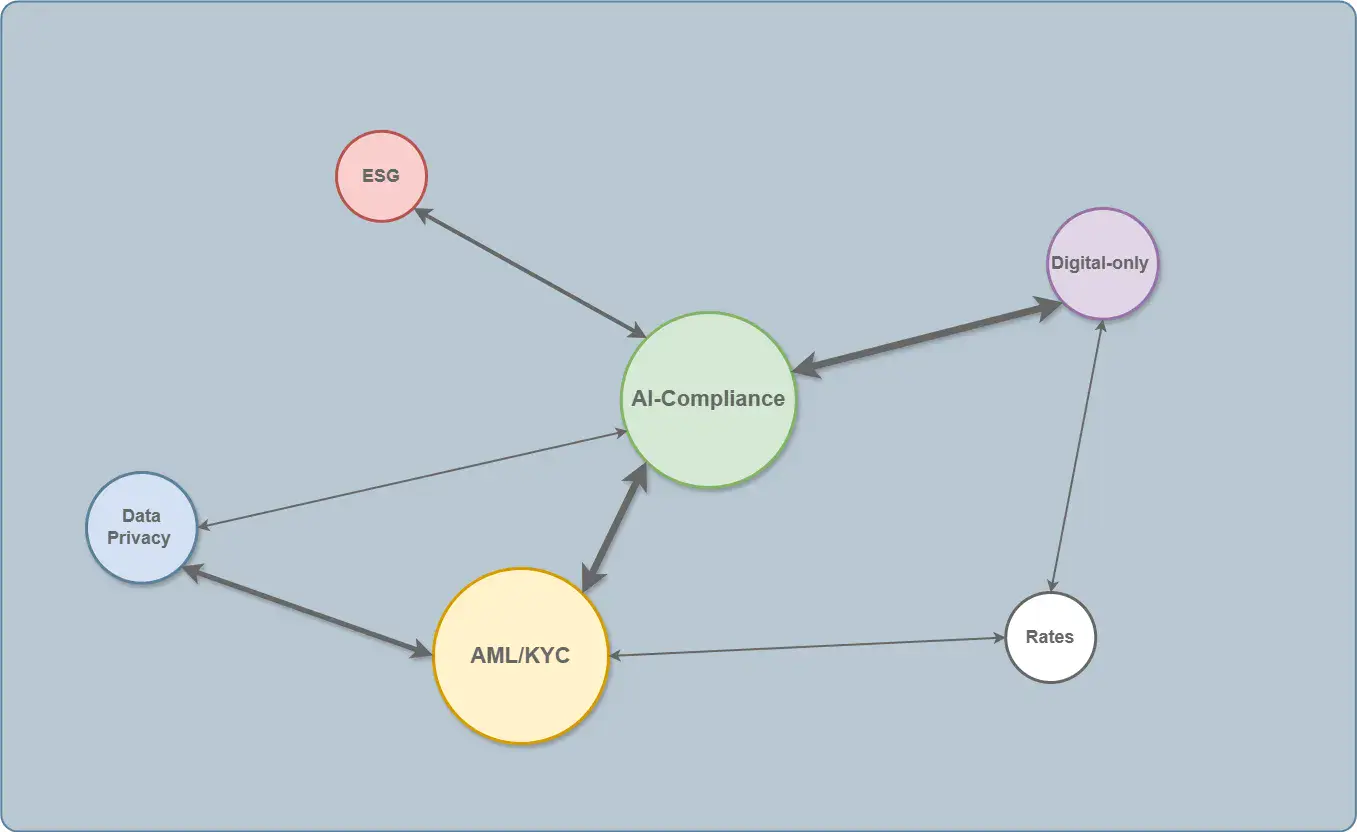
Driver vs Vulnerability Quadrant: Cross-Impact Assessment Summary
4. Sensitivity Mapping — Project Sensitivity to Scenarios
Methodology
1.We form scenarios from clusters of trends identified through Cross-Impact (for example, “RegTech squeeze” = AML/KYC + Privacy + AI).
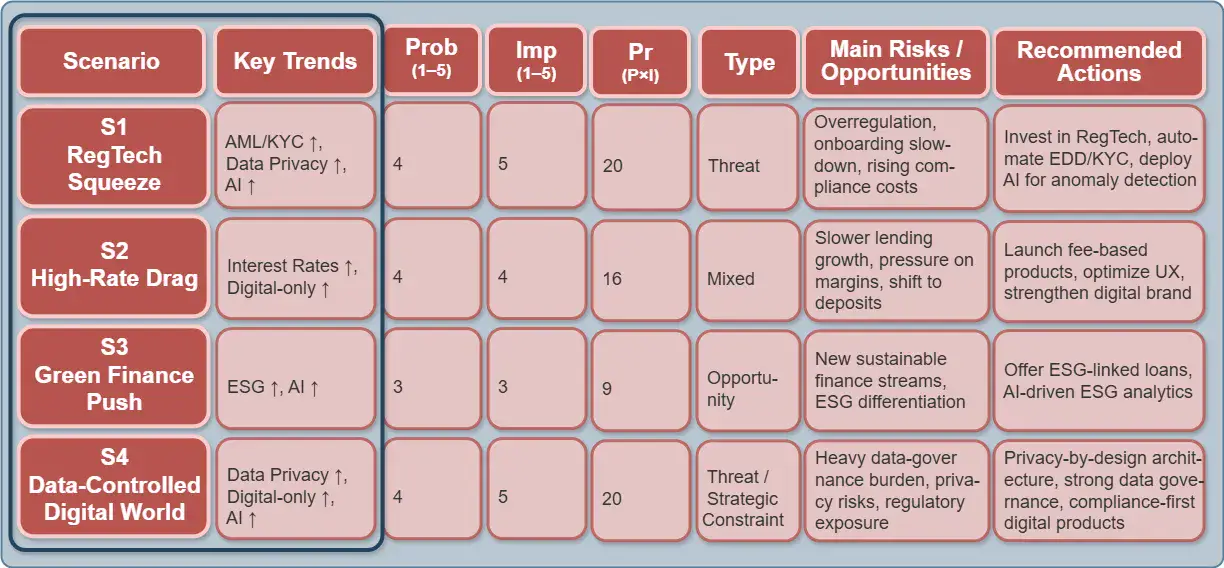
2.We evaluate each scenario using the following scales:

-

Business-as-Usual
— minimal changes
-

Disruption
— structural shifts and regulatory shocks
-

Transformation
— sustainable transformation of the banking model
We build a Sensitivity Matrix (probability × impact).
Sensitivity Matrix – Scenarios vs Outcomes
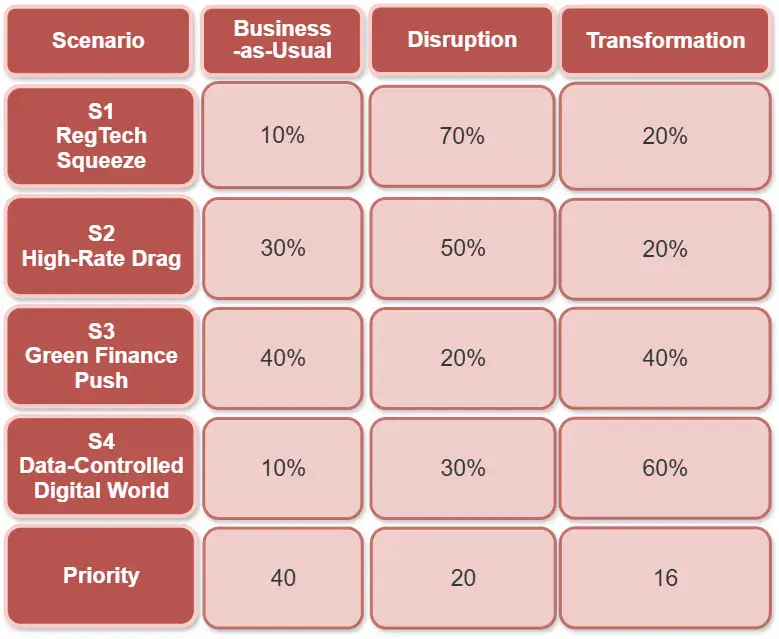
The table shows the probabilistic distribution of outcomes for three scenarios (S1–S4) depending on the type of future:
-
Probability (1–5)
— the total impact of a trend on other factors → indicates who “drives the system.”
-
Impact (1–5)
— strength of impact on the project;
-
Type
— Opportunity / Threat / Mixed;
-

Priority
= P × I — priority for monitoring.
The table shows the probabilistic distribution of outcomes for three scenarios (S1–S4) depending on the type of future:
Interpretation for the “Opening a Bank in the USA” Case:
S1 — RegTech Squeeze — the zone of maximum sensitivity and risk. A scalable RegTech architecture and AI-driven compliance automation are required.
S2 — High-Rate Drag — medium sensitivity. Flexibility in interest rate policy is needed, with a focus on fee-based and digital products.
S3 — Green & Lean Finance — a strategic opportunity to position the bank in ESG and sustainable finance.
S4 — Data-Controlled Digital World — the core transformational scenario that defines the rules of the game for all others: without mature data governance, the bank becomes non-viable regardless of macroeconomic conditions.
Scenario Composition Sankey (Trends → Scenarios)
Risk / Opportunity Matrix (Scenario Sensitivity Mapping)

For the “Opening a Bank in the USA” Case:
-
Regulatory Pressure (S1)
— the zone of maximum risk, requiring immediate adaptation of architecture, AML/KYC processes, and RegTech.
-

High Interest Rates (S2)
— a scenario of managed uncertainty, affecting lending and deposit strategy.
-

ESG and AI Transformation (S3)
— a window of long-term opportunities and strategic positioning.
-

Data-Controlled Diital World (S4)
— a foundational constraint defining requirements for IT architecture, data, and compliance across all scenarios.
The matrix is used together with the Scenario Evaluation Table,
where risks, opportunities, and response measures are defined for each scenario.
Scenario → KPI Tornado Chart
Trigger Monitor — RAG Dashboard (Scenario Monitoring Indicators)
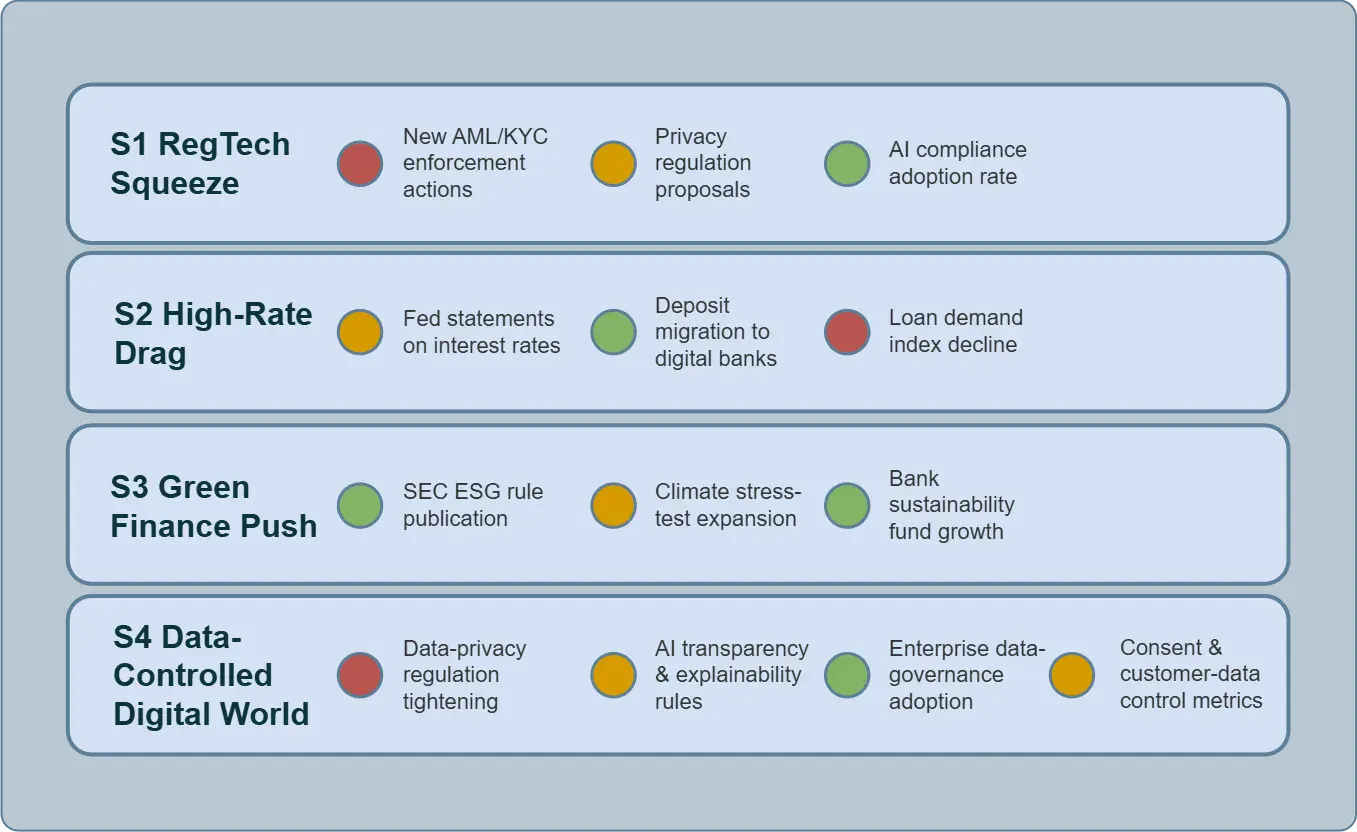
| Stage | Input Data | Output (Result) | Transitions To |
|---|---|---|---|
| Scenario Trend Scan | Validated factors with sources | Trend priorities, their dynamics and probabilities | Cross-Impact Assessment |
| PESTEL | Research of factors by categories | Table of factors with weights | Scenario Trend Scan |
| Sensitivity Mapping | Scenarios from Cross-Impact | Map of risks, opportunities, and KPI sensitivity | Monitoring and strategy |
| Cross-Impact | Priority trends | Network of interconnections and drivers | Sensitivity Mapping |
Link to Subsequent Stages:
The results of macro-factor analysis serve as the foundation for competitive analysis:
they establish a fair “market background” and help identify which trends affect all players.
On this foundation, the following are built:
-
assessment of market opportunities (Opportunities);
-
identification of threats (Threats);
-
strategic scenarios for project adaptation.
How All Visualizations are Read Together:
-

PESTEL Table + Dashboard
→ shows the environmental context and pressure.
-

Trend Matrix + Trend Cards
→ shows trajectories of change.
-

Cross-Impact Matrix + Network Graph
→ shows mutual influence between trends.
-
Sensitivity Tables + Scenario Mapacy ↑
→ shows scenario priorities for action.
Overall Meaning of the “Opening a Bank in the USA” Case:
The Charts Show That:
-
Regulatory trends are intensifying (AML/KYC, Privacy).
-
Technological trends (AI, RegTech) are becoming the response to pressure.
-
Social trends (Gen Z digital adoption) are shifting the business model online.
-
The economic environment (high-for-longer rates) constrains growth.
As a result, three systemic scenarios emerge:
-
RegTech Squeeze (threat/opportunity) — rising costs and innovation in compliance.
-
High-Rate Drag (threat) — pressure on margins and cost of capital.
-
Green & Lean (opportunity) — growth of green products and technological efficiency.


