STEEP
DESTEP
Psychographics
MMM
Neural attribution
Sentiment AI
SO–WO–ST–WT hypotheses
Viral loops
Referral loops
Product triggers
Behavioral nudges
Automated attribution
W–T risk
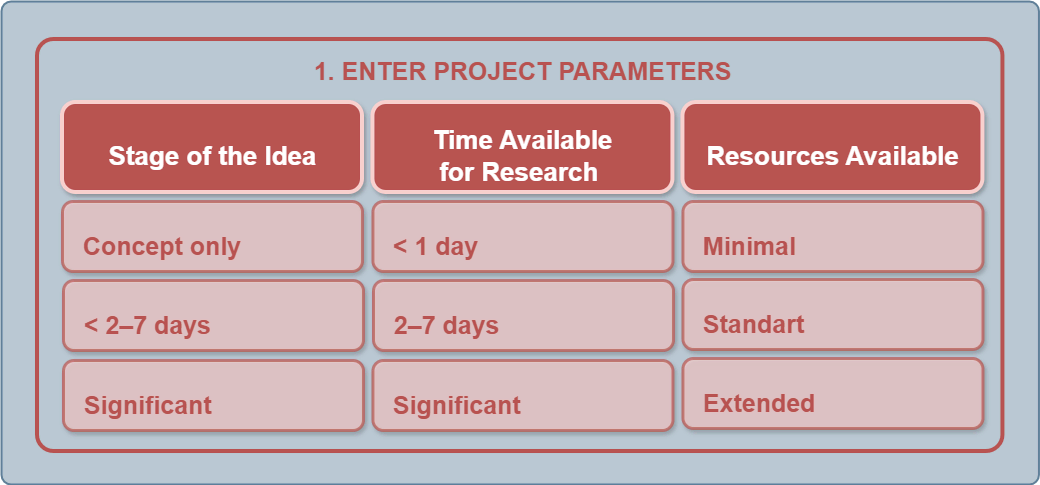
Environment
Customer
Market
Strategy


-
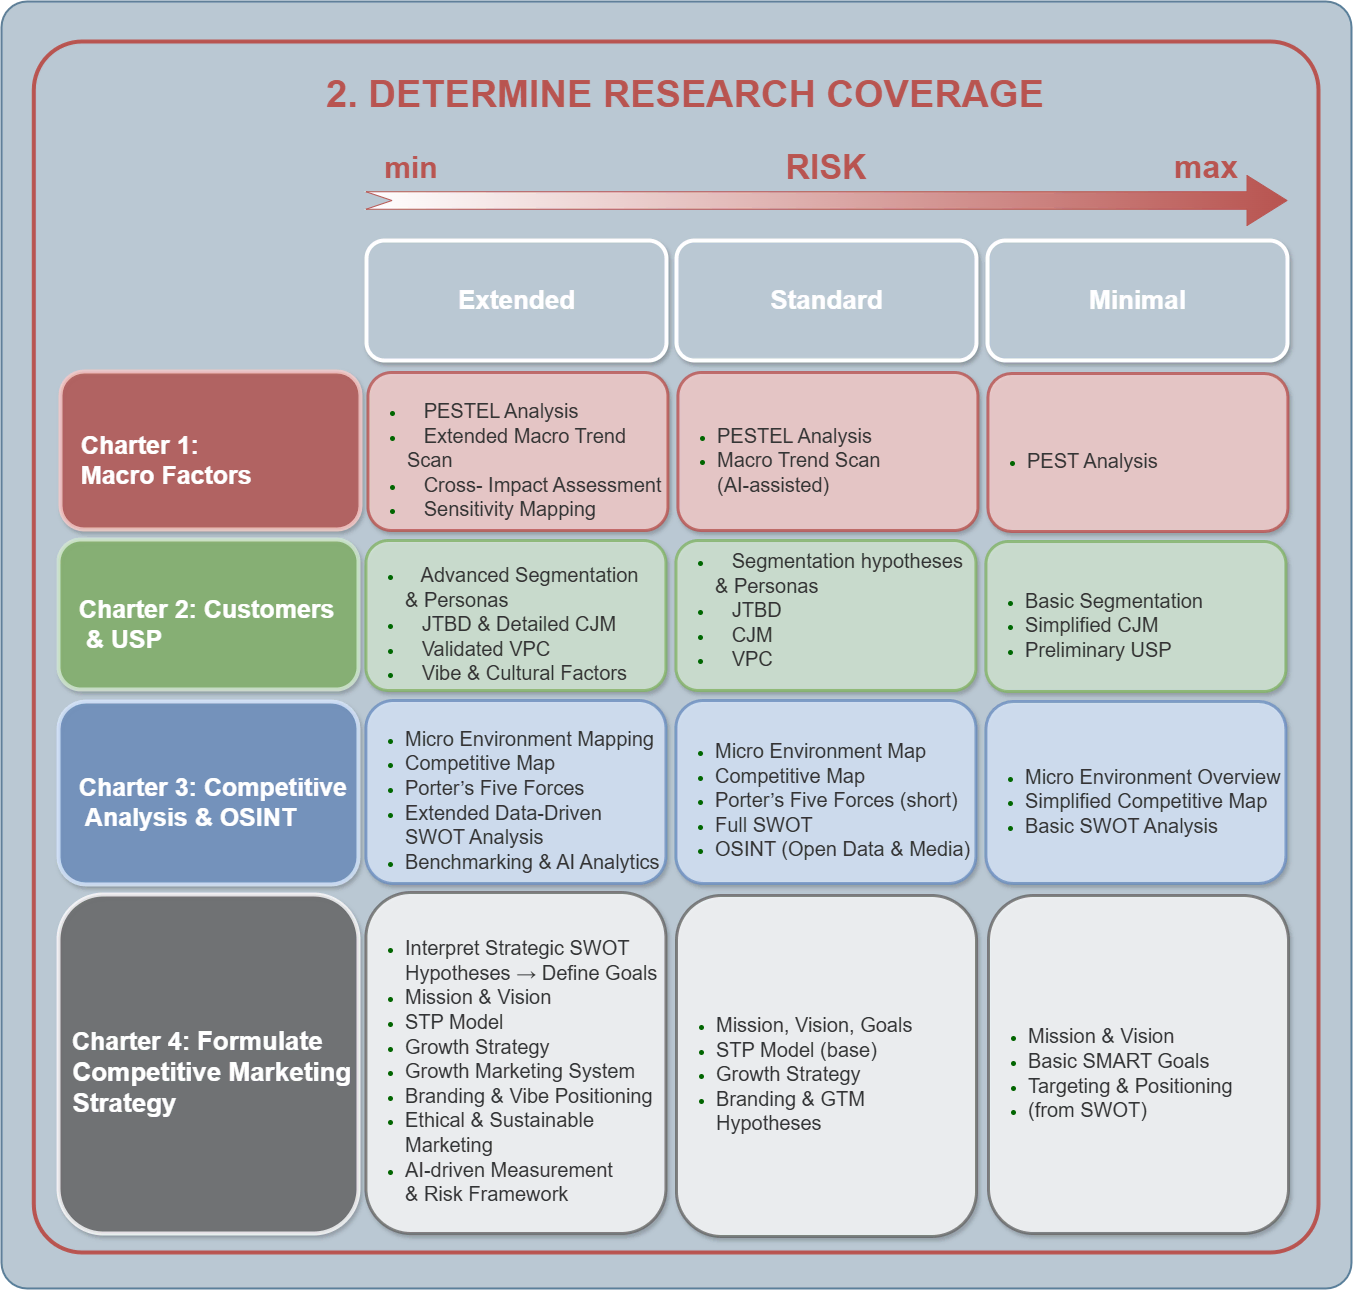
PESTEL Analysis
a basic framework for analyzing the external environment.
-

Scenario Trend Scan (STEEP/DESTEP)
identification of long-term trends and early signals.
-

Cross-Impact Assessment
evaluation of how factors interact (e.g., how technological progress affects legislation).
-
Sensitivity Mapping
visualization of which scenarios are most risky or promising.
-

Segmentation & Personas
identifying customer groups based on demographic, behavioral, and psychographic characteristics.
-
JTBD (Jobs To Be Done)
analyzing the context in which the customer “hires” the product to accomplish a task.
-
Customer Journey Map (CJM)
visualizing the customer’s path from need awareness to post-purchase experience.
-

Value Proposition Canvas (VPC) → USP
aligning customer pains and product value into a cohesive offering.
-

Vibe & Cultural Factors
emotional codes, cultural markers, and references that shape the brand’s “atmosphere.”
-

Micro-environment Mapping
mapping suppliers, partners, customers, substitutes, and competitors.
-

Competitive Map (Value–Price or Feature–Benefit)
visual comparison of players’ positions.
-

Porter’s Five Forces
pressure from suppliers, customers, substitutes, new entrants, and the level of intra-industry rivalry.
-
Extended Data-Driven SWOT Analysis:
deep SWOT with digital metrics and data analytics.
-

CSF (Critical Success Factors)
key success criteria in the market.
-

CPM (Competitive Profile Matrix)
comparing us and competitors across CSFs.
-

Competitive Polygon
visualization of strengths and weaknesses.
-

Integration of O/T
adding external factors from PESTEL.
-

Strategic SWOT Matrix (Analytical)
generating S–O, S–T, W–O, and W–T hypotheses.
-

Benchmarking & AI Analytics
analysis of digital data, trends, reviews, and attribution (MMM, neural attribution, sentiment AI).
-
Interpret Strategic SWOT Hypotheses → Strategic Goals
prioritizing hypotheses and setting measurable objectives.
-

Mission & Vision
defining the long-term purpose and the desired future state.
-

STP (Segmentation → Targeting → Positioning)
selecting target segments and building positioning.
-

Growth Strategy (Ansoff Matrix)
choosing growth scenarios: market penetration, product development, market development, diversification.
-

Growth Marketing System*
a systematic growth cycle: hypothesis creation, A/B tests, iterations, analytics.
-

Growth Hacking
a growth accelerator: short, low-cost experiments with high viral potential (referral loops, viral loops, product triggers, behavioral nudges).
-

Branding & Vibe Positioning
emotional brand identity, cultural code, product atmosphere.
-

Ethical & Sustainable Marketing
incorporating transparency, sustainability, and trust principles.
-

AI-Driven Measurement & Risk Framework
data-driven management: KPIs, automated attribution, W–T risk modeling from SWOT.

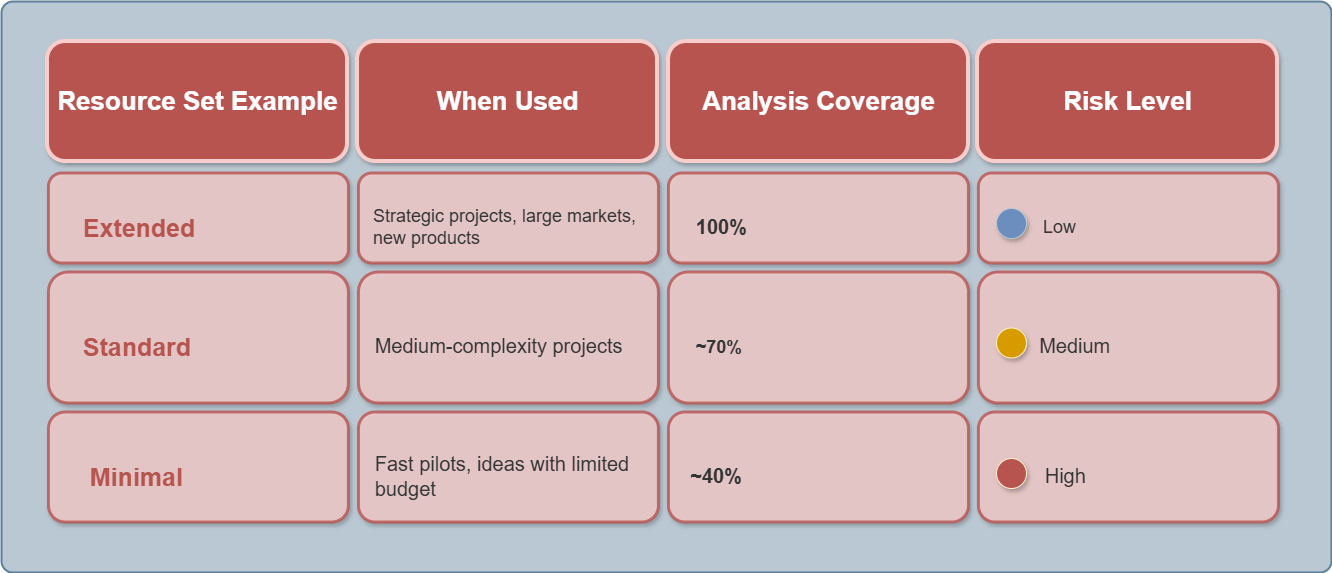
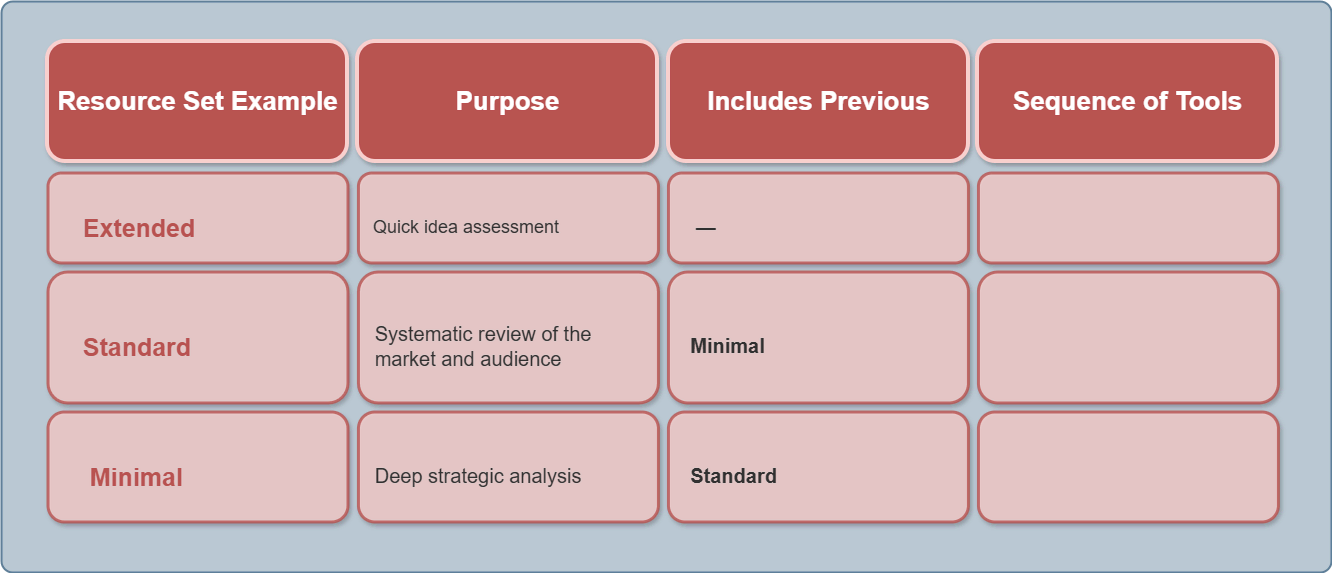
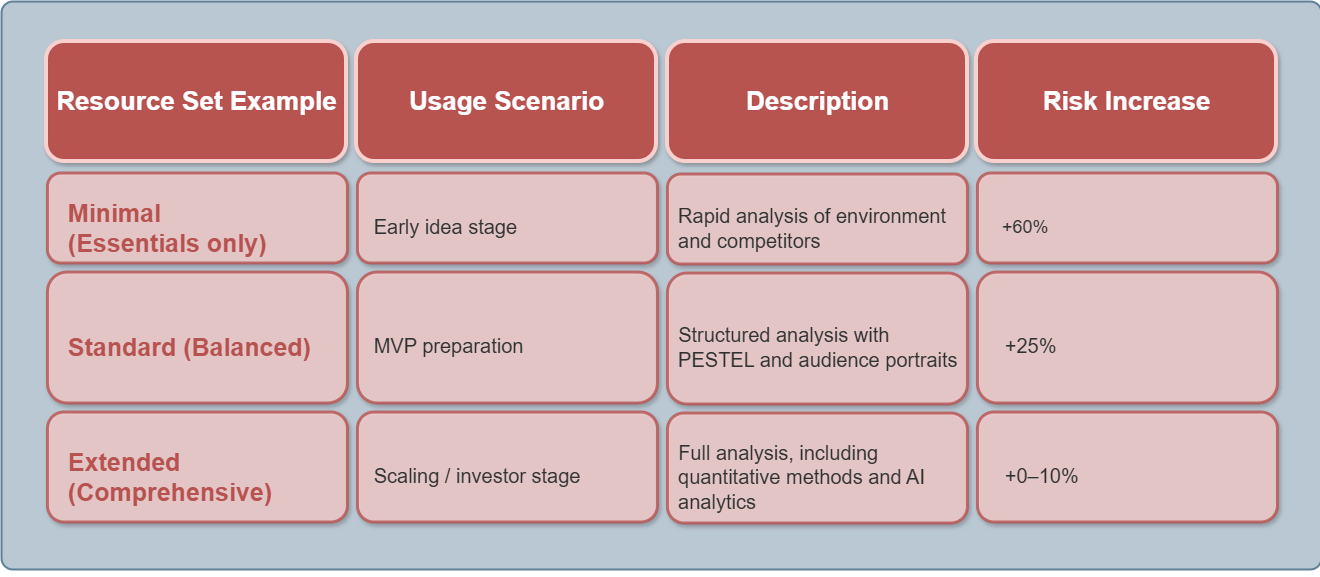
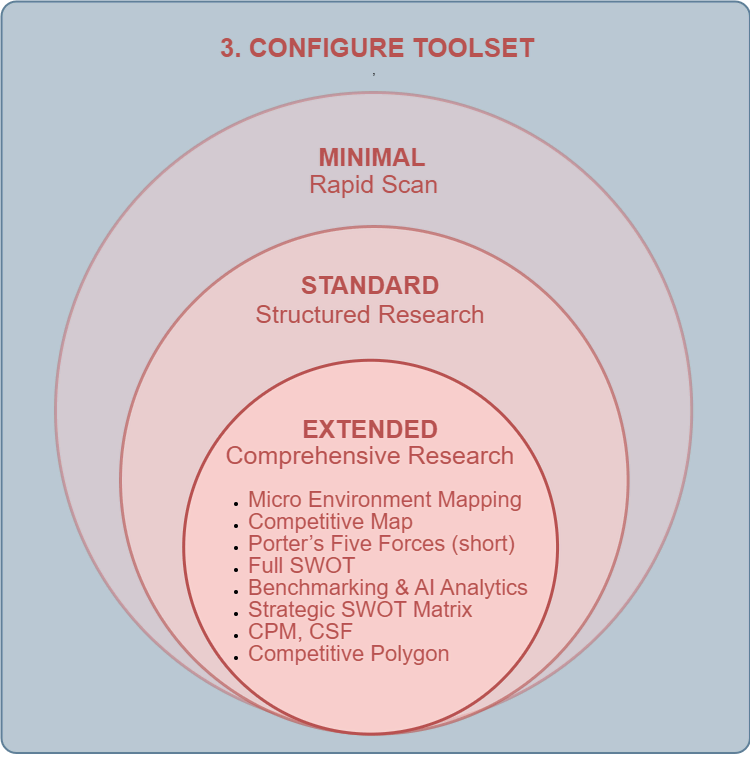
![]() Extended Resource Set:
Extended Resource Set:
-

PESTEL Analysis
a full examination of political, economic, social, technological, environmental, and legal factors.
-

Extended Macro Trend Scan
scenario-based trend modeling (STEEP/DESTEP), detection of early signals.
-
Cross-Impact Assessment
analyzing interdependencies between trends (e.g., Tech–Legal, Eco–Social).
-
Sensitivity Mapping
assessing how sensitive the project is to different scenarios.
![]() Standard Resource Set:
Standard Resource Set:
-
PESTEL Analysis (short)
key macro factors.
-
Macro Trend Scan (AI-assisted)
major drivers and barriers.
![]() Minimal Resource Set:
Minimal Resource Set:
-
PEST Analysis
political, economic, social, and technological factors.


-
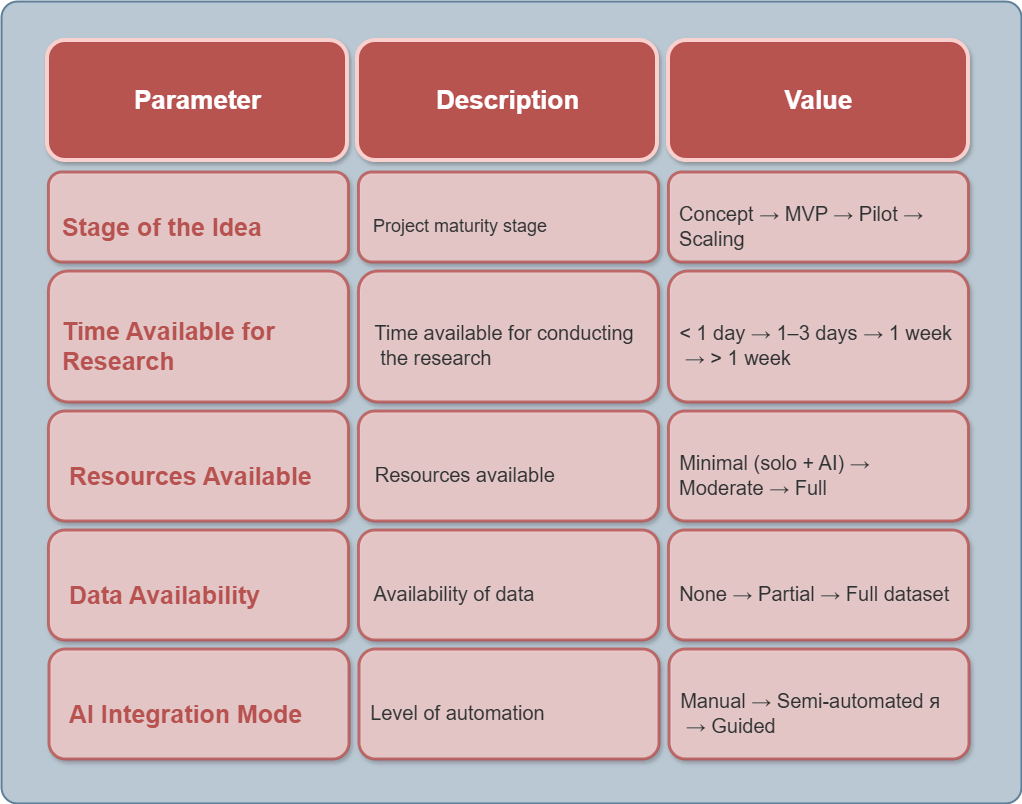
Little Time
quantitative methods are excluded, only qualitative methods remain.
-
Limited Budget
AI replaces field research with secondary data.
-

Lack of Data
AI focuses on generating and validating hypotheses.


-

intentional
risks and trade-offs are visible immediately;
-
adaptive
coverage is adjusted based on resources;
-

intelligent
AI handles routine work while the human approves the meaning;
-

universal
suitable for both startups and corporate teams.
-
Research
is not “just another document,” but a system of interlinked steps: each stage feeds the next.
-
Strategic SWOT Matrix
is a bridge between analytics and strategy: we generate hypotheses at Step 3, and then interpret and prioritize them at Step 4.
-
Communications
are only the tip of the iceberg; the reliability of decisions depends on the quality of the underwater part — research and strategy.